by Calculated Risk on 1/05/2010 09:49:00 AM
Tuesday, January 05, 2010
Pending Home Sales Decrease Sharply
The Pending Home Sales Index,* a forward-looking indicator based on contracts signed in November, fell 16.0 percent to 96.0 from an upwardly revised a 114.3 in October, but is 15.5 percent higher than November 2008 when it was 83.1.On the extended and expanded tax credit:
[Lawrence Yun, NAR chief economist] projects an additional 900,000 first-time buyers will qualify for the extended tax credit in addition to about 2 million who have already purchased; 1.5 million repeat buyers also are expected to benefit from the credit.The extended and expanded tax credit was estimated to cost taxpayers $10.8 billion, but based on Mr. Yun's numbers, the tax credit will cost close to $17 billion (way over the initial estimate and just like the first tax credit, most buyers who receive the tax credit would have bought anyway).
Personal Bankruptcy Filings Increase Sharply in 2009
by Calculated Risk on 1/05/2010 08:40:00 AM
The WSJ reports: Personal Bankruptcy Filings Rising Fast
Overall, personal bankruptcy filings hit 1.41 million last year, up 32% from 2008, according to the National Bankruptcy Research Center ...
 Click on graph for larger image in new window.
This graph shows the non-business bankruptcy filings by year.
Note: Data from Administrative Office of the U.S. Courts, 2009 is estimated using media reports of data from the National Bankruptcy Research Center.
The annual rate is at about the same level as prior to when the Bankruptcy Abuse Prevention and Consumer Protection Act of 2005 (BAPCPA) took effect. There were over 2 million bankruptcies filed in Calendar 2005 ahead of the law change.
"I can't see over the top of the files on my desk," said Cathleen Moran, a bankruptcy attorney at Moran Law Group in Mountain View, Calif., likening it to the rush of clients before the revised law went into effect.
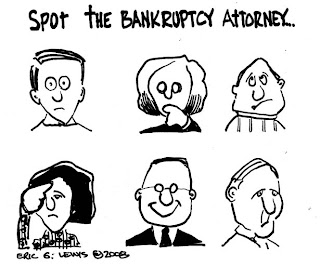
 | Click on cartoon for larger image in new window. And a repeat: Cartoon from Eric G. Lewis, a freelance cartoonist living in Orange County, CA. |
Monday, January 04, 2010
Krugman: 30% to 40% Chance of 2010 Recession
by Calculated Risk on 1/04/2010 11:55:00 PM
From Bloomberg: Krugman Sees 30-40% Chance of U.S. Recession in 2010 (ht many thanks!)
“[A recession] is not a low probability event, 30 to 40 percent chance,” [Paul] Krugman said today in an interview in Atlanta, where he was attending an economics conference. “The chance that we will have growth slowing enough that unemployment ticks up again I would say is better than even.”On the recession probabilities, I think Professor Krugman is warning policy makers about complacency, similar to his Monday column: That 1937 Feeling.
My guess is the U.S. will see sluggish growth in 2010, but will avoid a recession. However I do think the unemployment rate ticking up from the current 10% is a high probability event.
Unofficial Problem Bank List Change Summary
by Calculated Risk on 1/04/2010 08:42:00 PM
Commentary from surferdude808:
Since August 7, 2009, each week an Unofficial Problem Bank List has been posted to Calculated Risk. The Unofficial Problem Bank List is an attempt to mirror the number of problem banks the FDIC reports each quarter.
The FDIC does not disclose the institutions on its Problem Bank List and CAMELS ratings are confidential. For the most part, institutions on the FDIC Problem Bank List have a CAMELS rating of 4 or 5. Normally, problem institutions or those with a CAMELS rating of 4 or 5 are subject to a safety & soundness formal enforcement action by their respective primary federal supervisor (Federal Reserve, FDIC, OCC, or OTS).
Since the last crisis, much to the consternation of the federal supervisory agencies, they are required to make all formal enforcement actions public. Historically, there is a high positive correlation between a safety & soundness formal enforcement action and a CAMELS rating of 4 or 5. This relationship is the basis for the Unofficial Problem Bank List, which is comprised of institutions operating under a safety & soundness formal enforcement action, and some institutions that have made public announcements that lead us to believe a formal enforcement action is likely.
With the passage of the year, we thought it would be of interest to analyze how the Unofficial Problem Bank List has changed since it was first published. The list had 389 institutions on August 7, 2009 and it finished the year at 575. During the past five months, there have been 277 additions and 91 deletions.
There are four ways to be removed from the list – failure, voluntary dissolution, merger with another institution (without FDIC assistance), or improvement in condition whereby the action is terminated. Of the 91 deletions, 74 are from failure, 9 are from termination of the enforcement action, and 8 are from an unassisted merger.
Of the 389 institutions on the August 7, 2009 list, 325 are still on the January 1, 2010 list as 64 were removed because of failure (48), action termination (9), and unassisted merger (7). Interestingly, 26 institutions that were added after August 7, 2009 failed before January 1, 2010.
So far, only 74 or 11.1 percent of the 666 institutions that have been on the list have failed. However, failure is the cause for 81.3 percent of all deletions. While failures only represent 11.1 percent of institutions that have appeared on the list, failed bank assets (quarter before failure) of $135.8 billion represent 30 percent of the $450.2 billion of assets that have been on the list. Moreover, failure is responsible for 98 percent of the $138.6 billion of assets of institutions deleted from the list. Thus, for the second half of 2009, failure was the primary way institutions and assets were removed from the list.
| Unofficial Problem Bank ListChange Summary | |||
|---|---|---|---|
| Number of Institutions | Assets ($Thousands) | ||
| Start | (8/7/2009) | 389 | 276,313,429 |
| Additions | 277 | 173,919,123 | |
| Subtractions | |||
| Action Terminated | 9 | 1,605,652 | |
| Unassisted Merger | 8 | 1,141,008 | |
| Failures | 74 | 135,814,823 | |
| Asset Change | 8,453,550 | ||
| End | (1/01/2010) | 575 | 303,217,519 |
Oil Prices Push Above $81 per Barrel
by Calculated Risk on 1/04/2010 05:51:00 PM
From the NY Times: Oil Surges Above $81, Driven by Several Factors
A combination of frigid weather, expectations of an improving economy and new tensions between Russia and Belarus catapulted crude oil prices above $81 a barrel on Monday.Higher prices could impact the U.S. economic recovery (it is probably time to start watching U.S. vehicle miles driven again). Here is a graph of nominal oil prices ...
 Click on graph for larger image in new window.
These are spot prices for Cushing WTI from the EIA (source).
Back in the Spring of 2008, we started seeing many signs of potential demand destruction - including fewer U.S miles driven, Asian countries reducing gasoline subsidies, and China stock piling oil for the Olympics.
And maybe we are seeing the first signs of demand destruction again, since the Dept of Transportation reports that U.S. vehicle miles declined in October: Traffic Volume Trends
Travel on all roads and streets changed by -0.5% (-1.4 billion vehicle miles) for October 2009 as compared with October 2008. ...
Cumulative Travel for 2009 changed by +0.2% (4.8 billion vehicle miles).
 The second graph shows the comparison of month to the same month in the previous year as reported by the DOT.
 Miles driven in October 2009 were 0.5% less than in October 2008, the first year-over-year decline since May 2009.
Still - I haven't seen any stories like the following from the NY Times on June 28, 2008: Cruise Night, Without the Car
For car-loving American teenagers, this is turning out to be the summer the cruising died.There couldn't have been a clearer sign of a top in oil!
...
From coast to coast, American teenagers appear to be driving less this summer. Police officers who keep watch on weekend cruising zones say fewer youths are spending their time driving around in circles...
Employment Week: Census and ISM
by Calculated Risk on 1/04/2010 03:38:00 PM
This will be busy week for employment related reports culminating with the BLS report on Friday. Here is some info on the impact of Census 2010 on employment, and the relationship between the ISM manufacturing report and BLS reported manufacturing payroll jobs. Click on photo for hi-res image in new window.
The Census Bureau kicked off the Census 2010 road tour today.
During the next four months, the tour will be part of the largest civic outreach and awareness campaign in U.S. history -- stopping and exhibiting at more than 800 events nationwide.Of course most of the Census will be conducted by mail in March, with followup visits for non-respondents. As we discussed on Friday, the Census Bureau will hire temporary census takers for most of the followup work (See: Impact of Census on Employment and Unemployment Rate).
The key point is that Census 2010 will boost employment in March, April and especially in May. And this boost will mostly be unwound over the period June through September. The Census gives, and the Census takes.
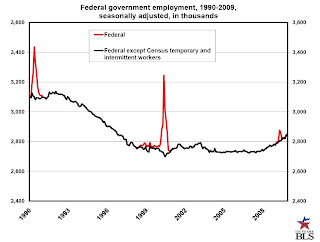
 To track the impact on employment, the BLS provides a monthly report of Census hiring. This graph is from the BLS report and shows the historical impact of the Census on Federal Government employment.
There was a small spike in employment in April 2009, and currently the decennial census has little impact on employment. This will be something to check every month - especially from March through September.
And from the ISM Manufacturing report this morning on employment:
ISM's Employment Index registered 52 percent in December, which is 1.2 percentage points higher than the 50.8 percent reported in November. This is the third month of growth in manufacturing employment, following 14 consecutive months of decline. An Employment Index above 49.7 percent, over time, is generally consistent with an increase in the Bureau of Labor Statistics (BLS) data on manufacturing employment.The following graph shows the ISM Manufacturing Employment Index vs. the BLS reported monthly change in manufacturing employment (as a percent of manufacturing employment).
emphasis added
The graph includes data from 1948 through 2009. The earlier period (1948 - 1988) is in red, and the last 20 years is in blue.
 This shows that the ISM employment index is related to changes in BLS employment.
The relationship is noisy, and the equation is for just the last 20 years. This suggest the ISM employment index of about 51.3 is consistent with an increase in BLS reported manufacturing employment. This is higher than the ISM estimate that appears to be based more on older data.
Fed's Duke on Economic Outlook
by Calculated Risk on 1/04/2010 01:09:00 PM
From Fed Governor Elizabeth Duke: The Economic Outlook
In my view, the outlook for economic activity depends importantly on our ability to build on the progress to date in improving the operation of financial markets and restoring the flow of credit to households and businesses.I think Ms. Duke is somewhat too optimistic on housing and employment. It might take more payroll jobs to lower the unemployment rate this time because the Labor Force Participation Rate has declined so sharply; the BLS reported the participation rate as 65.0% in November (the percentage of the working age population in the labor force). This is the lowest level since the mid-80s, and I expect a number of people will rejoin the labor force at the first sign of an employment recovery, putting upward pressure on the unemployment rate.
Although household wealth has received a boost from the gains in the stock market over the last nine months and from the stabilization in house prices, household balance sheets remain weak. In 2009, household income received some temporary support from the tax cuts and transfer payments enacted with the fiscal stimulus package and from the extensions of unemployment insurance. Over the coming year, households should begin to see gains in income associated with an improvement in the labor market, and the drag on spending from past declines in real net worth should ease. As their income and balance sheets improve, consumers should have better access to credit. Favorable trends in income and employment should also bolster consumer confidence, although one risk I see to the outlook for household spending is the possibility of a rise in the personal saving rate as consumers choose to shore up their balance sheets rather than spend. While good in the long run, increased saving means consumers are providing less of a short-run boost to the economy.
The outlook for homebuilding will depend critically on the continuation of the uptrend in the demand for housing that began in early 2009. I anticipate that low mortgage rates and house prices that are still very low compared with the recent past will continue to provide important support for demand. And a shift in expectations from falling house prices to modest appreciation should encourage buyers to invest in houses. That said, the headwinds in housing and mortgage markets remain relatively strong and are likely to restrain the pace at which the residential construction sector recovers. Many of the existing homeowners who face payment problems are having trouble restructuring their loans, and the large backlog of foreclosed properties will likely take several years to resolve. Tighter standards for government-backed loans and still-restrictive credit conditions in private loan markets are also likely to slow the housing recovery. Nevertheless, with the inventory of new homes having been worked down to a relatively low level, even a gradual strengthening of demand should lead to an upturn in homebuilding.
Prospects for a recovery in business investment are getting better as we move into 2010. Typically, business confidence builds as firms see a sustained increase in sales and output. Various indicators of business sentiment rebounded over the second half of 2009 as economic activity accelerated, and the latest surveys of capital spending plans have been more positive. That said, the amount of unused capacity in the business sector is substantial, which implies that the recovery in spending on equipment and software will likely be more gradual than typically occurs during a cyclical recovery.
...
Unfortunately, the outlook for commercial real estate is much less favorable. Hit hard by the loss of businesses and employment, a good deal of retail, office, and industrial space is standing vacant. In addition, many businesses have cut expenses by renegotiating existing leases. The combination of reduced cash flows and higher rates of return required by investors leads to lower valuations, and many existing buildings are selling at a loss. As a result, credit conditions in this market are particularly strained. Commercial mortgage delinquency rates have soared. ...
In this environment, a turnaround in CRE is likely to lag the improvement in overall economic activity. However, compared with the situation in the early 1990s, the problems in this sector now appear to be due largely to poor business fundamentals rather than widespread overbuilding, suggesting that the performance of the CRE sector will gradually begin to improve as the economy continues to strengthen.
An important element of a sustained economic recovery will be an improvement in labor market conditions. Employment gains typically lag the recovery in sales and production in the early months of an economic upturn. In many cycles, the lag occurs because businesses need to restore productivity and are reluctant to hire until they are more confident that any pickup in sales will be maintained. In this cycle, the reductions in jobs and hours of work have been so deep, and the pressure to cut costs has been so strong, that businesses in the aggregate have already realized solid gains in productivity. As a result, I expect that businesses will begin to add jobs this year, but I anticipate that they will do so cautiously in order to hang on to their cost savings and efficiency gains.
Even as the unemployment rate begins to decline later this year, it likely will remain high by historical standards. Based on the experience of the last two economic recoveries, net gains of roughly 100,000 payroll jobs each month are needed to reduce the jobless rate by 0.1 percentage point. ...
emphasis added
Construction Spending Declines in November
by Calculated Risk on 1/04/2010 10:23:00 AM
Through November construction spending has followed the expected script for 2009: a likely bottom for residential construction spending, and a collapse in private non-residential construction.
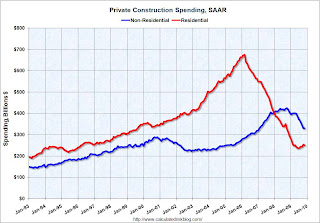
Residential construction spending was off slightly in November, and is now only 5.8% above the bottom earlier in 2009. I expect some residential spending growth in 2010, but the increases in spending will probably be sluggish until the large overhang of existing inventory is reduced.
Non-residential appeared flat in November, but that was only because of a downward revision to October spending. The collapse in non-residential construction spending continues ...  Click on graph for larger image in new window.
The first graph shows private residential and nonresidential construction spending since 1993. Note: nominal dollars, not inflation adjusted.
Residential construction spending decreased in November, and nonresidential spending continued to decline.
Private residential construction spending is now 62.9% below the peak of early 2006.
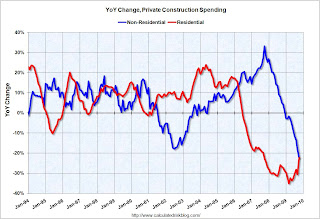
Private non-residential construction spending is 22.5% below the peak of October 2008. The second graph shows the year-over-year change for private residential and nonresidential construction spending.
Nonresidential spending is off 22.5% on a year-over-year (YoY) basis.
Residential construction spending is still off 22.2% from a year ago, but the negative YoY change is getting smaller.
For the first time since the housing bust started, nonresidential spending is off more on a YoY basis than residential.
Here is the report from the Census Bureau: November 2009 Construction at $900.1 Billion Annual Rate
ISM Manufacturing Index shows Expansion in December
by Calculated Risk on 1/04/2010 10:00:00 AM
PMI at 55.9% in December, from 53.6 in November, and down from 55.7 in October.
From the Institute for Supply Management: December 2009 Manufacturing ISM Report On Business®
Economic activity in the manufacturing sector expanded in December for the fifth consecutive month, and the overall economy grew for the eighth consecutive month, say the nation's supply executives in the latest Manufacturing ISM Report On Business®.As noted, any reading above 50 shows expansion.
The report was issued today by Norbert J. Ore, CPSM, C.P.M., chair of the Institute for Supply Management™ Manufacturing Business Survey Committee. "The manufacturing sector grew for the fifth consecutive month in December as the PMI rose to 55.9 percent, its highest reading since April 2006 when it registered 56 percent. This month's report is quite strong as both the New Orders and Production Indexes are above 60 percent. The sector may be benefiting from an excessive destocking cycle as indicated by the recent performance of the Customers' Inventories Index. Customers' inventories have been 'too low' for nine consecutive months, and this month's index is the lowest reading since the inception of the index in January 1997. Overall, the recovery in manufacturing is continuing, but there are still some industries mired in the downturn as evidenced by the seven industries still in decline."
...
ISM's Employment Index registered 52 percent in December, which is 1.2 percentage points higher than the 50.8 percent reported in November. This is the third month of growth in manufacturing employment, following 14 consecutive months of decline. An Employment Index above 49.7 percent, over time, is generally consistent with an increase in the Bureau of Labor Statistics (BLS) data on manufacturing employment.
emphasis added
California to "aggressively seek new federal assistance"
by Calculated Risk on 1/04/2010 08:40:00 AM
From Wyatt Buchanan at the San Francisco Chronicle: California leaders seek budget help from D.C.
California's political leaders, who are facing the daunting challenge of closing an estimated $20.7 billion budget deficit this year, are looking to Washington for help. Just don't call it a bailout.As the article notes, California sends far more to Washington D.C. then they receive (they are 43rd on the list of states) - we will probably hear more of that argument. Hey - it is an investment, not a bailout!
...
"No one is looking for a bailout. We're looking for an investment," [Senate President Pro Tem Darrell Steinberg] said ...
On Friday, Schwarzenegger will release his initial budget proposal for the next fiscal year, and the Legislative Analyst's Office already has called on state leaders to "aggressively seek new federal assistance" to help close the projected deficit.


