by Calculated Risk on 9/26/2010 02:02:00 PM
Sunday, September 26, 2010
Weekly Schedule for September 26th
The previous post is the Summary for Week ending Sept 25th
The key economic releases this week are the ISM Manufacturing index on Friday (and the regional releases earlier in the week), and the personal income and spending report for August (also on Friday). For housing, the key economic release is the S&P/Case-Shiller Home price index on Tuesday. There will be several Fed speeches this week to review for possible hints on QE2.
8:30 AM ET: Chicago Fed National Activity Index (August). This is a composite index of other data.
10:30 AM: Dallas Fed Manufacturing Survey for September. The Texas survey showed a slight contraction last month (at -0.1%), and is expected to show contraction again in September. These regional surveys are important now since it appears manufacturing is slowing (or contracting like the Philly Fed survey showed on Sept 16th).
9:00 AM: S&P/Case-Shiller Home Price Index for July. Although this is the July report, it is really a 3 month average of May, June and July. Prices probably started falling again in July, but the price declines might not show up in this report. The consensus is for flat prices month-over-month in July.
10:00 AM: Richmond Fed Survey of Manufacturing Activity for September. The consensus is for a decrease in the index to +6 (still expanding) from 11 last month.
10:00 AM: Conference Board's consumer confidence index for September. The consensus is for a decrease to 52 from 53.5 last month. This is down sharply from May, and at about the same level as a year ago.
5:30 PM: Atlanta Fed President Dennis Lockhart speaks on the economic outlook.
7:00 AM: The Mortgage Bankers Association (MBA) will release the mortgage purchase applications index. This index declined sharply following the expiration of the tax credit, and the index has only recovered slightly over the last couple months - suggesting reported home sales through at least October will be very weak.
Fed Speeches: Minneapolis Fed President Narayana Kocherlakota, Philly Fed President Charles Plosser and Boston Fed President Eric Rosengren are all scheduled to speak. With QE2 clearly on the radar, these speeches will be closely watched.
8:30 AM: The initial weekly unemployment claims report will be released. Consensus is for a decline to 459,000 from 465,000 last week.
8:30 AM: Q2 GDP (third estimate). The consensus is for no change from the previous report (1.6% real annualized GDP growth in Q2).
9:45 AM: Chicago Purchasing Managers Index for September. The consensus is for a decline to 56.0 from 56.7 in August.
10:00 AM: Fed Chairman Ben Bernanke testifies on the Implementation of the Dodd-Frank Act before the Senate Committee on Banking, Housing, and Urban Affairs, U.S. Sentate
11:00 AM: Kansas City Fed regional Manufacturing Survey for September. The index declined sharply in August to 0 from 14 in July.
8:30 AM: Personal Income and Outlays for August. The concensus is for a 0.3% increase in personal income and a 0.4% increase in personal spending. Using this data we can obtain an early estimate for Q3 real PCE growth (annualized) using the two-month method (usually pretty close).
8:30 AM: New York Fed President William Dudley speaks at the SABEW conference in New York.
9:55 AM: Reuter's/University of Michigan's Consumer sentiment index (final for September). Consensus is for a slight increase 67.0 from the mid-month reading of 66.6.
10:00 AM: ISM Manufacturing Index for September. The consensus is for a decline to 54.5 from 56.3 in August.
10:00 AM: Construction Spending for August. The consensus is for a 0.4% decline in construction spending.
All day: Light vehicle sales for September. The manufacturers will report vehicle sales for September. Light vehicle sales are expected to increase slightly in September to around 11.6 million (Seasonally Adjusted Annual Rate), from 11.44 million in August.
After 4:00 PM: The FDIC might have another busy Friday afternoon ...
Summary for Week ending Sept 25th
by Calculated Risk on 9/26/2010 09:27:00 AM
A summary of last week - mostly in graphs.
There were a few key non-graphical stories this week: Fed Chairman Ben Bernanke expressed concern about the recovery, suggesting to many that QE2 will arrive in early November, Larry Summers is leaving the Obama Administration, the NBER announced the end date for the recent recession (June 2009), and the corporate credit union bailout was announced (coming for some time).
There are links for all of these stories and more at the bottom of this post.
The Census Bureau reported New Home Sales in August were at a seasonally adjusted annual rate (SAAR) of 288 thousand. This was unchanged from July.
 Click on graph for larger image in new window.
The first graph shows monthly new home sales (NSA - Not Seasonally Adjusted or annualized).
Note the Red columns for 2010. In August 2010, 25 thousand new homes were sold (NSA). This is a new record low for August.
The previous record low for the month of August was 34 thousand in 1981; the record high was 110 thousand in August 2005.
 The second graph shows New Home Sales vs. recessions for the last 47 years. The dashed line is the current sales rate.
 Sales of new single-family houses in August 2010 were at a seasonally adjusted annual rate of 288,000.
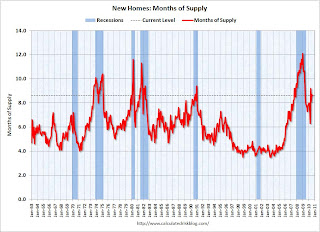
And another long term graph - this one for New Home Months of Supply.
 Months of supply decreased to 8.6 in August from 8.7 in July. The all time record was 12.4 months of supply in January 2009. This is still very high (less than 6 months supply is normal).
The 288 thousand annual sales rate for August is just above the all time record low in May (282 thousand). This was another very weak report. New home sales are important for the economy and jobs - and this indicates that residential investment will be a sharp drag on GDP in Q3.
The NAR reported: Existing-Home Sales Move Up in August
 This graph shows existing home sales, on a Seasonally Adjusted Annual Rate (SAAR) basis since 1993.
 Sales in August 2010 (4.13 million SAAR) were 7.6% higher than last month, and were 19.0% lower than August 2009 (5.1 million SAAR).
The next graph shows the year-over-year (YoY) change in reported existing home inventory and months-of-supply. Inventory is not seasonally adjusted, so it really helps to look at the YoY change.
 Although inventory decreased slightly from July 2010 to August 2010, inventory increased 1.5% YoY in August.
 Note: Usually July is the peak month for inventory.
The year-over-year increase in inventory is especially bad news because the reported inventory is already historically very high (around 4 million), and the 11.6 months of supply in August is far above normal.
The National Association of Home Builders (NAHB) reported the housing market index (HMI) was at 13 in September. This is the same low level as in August and below expectations. The record low was 8 set in January 2009, and 13 is very low ...
Note: any number under 50 indicates that more builders view sales conditions as poor than good.
 This graph compares the NAHB HMI (left scale) with single family housing starts (right scale). This includes the September release for the HMI and the July data for starts (August starts were released after this report).
This shows that the HMI and single family starts mostly move in the same direction - although there is plenty of noise month-to-month.
Press release from the NAHB: Builder Confidence Unchanged in September
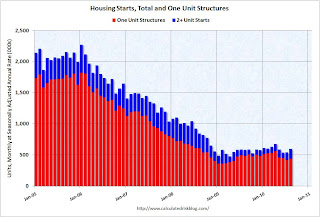
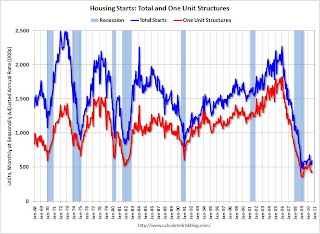
 Total housing starts were at 598 thousand (SAAR) in August, up 10.5% from the revised July rate of 541 thousand (revised down from 546 thousand), and up 25% from the all time record low in April 2009 of 477 thousand (the lowest level since the Census Bureau began tracking housing starts in 1959).
 Single-family starts increased 4.3% to 438 thousand in August. This is 22% above the record low in January 2009 (360 thousand).
 The second graph shows total and single unit starts since 1968. This shows the huge collapse following the housing bubble, and that housing starts have mostly been moving sideways for over a year - with a slight up and down over the last several months due to the home buyer tax credit.
Here is the Census Bureau report on housing Permits, Starts and Completions.
This was above expectations of 550 thousand, mostly because of the volatile multi-family starts. This low level of starts is good news for the housing market longer term (there are too many housing units already), but bad news for the economy and employment short term.
Note: This index is a leading indicator for new Commercial Real Estate (CRE) investment.
Reuters reports that the American Institute of Architects’ Architecture Billings Index increased to 48.2 in August from 47.9 in July. Any reading below 50 indicates contraction.
 This graph shows the Architecture Billings Index since 1996. The index has remained below 50, indicating falling demand, since January 2008.
According to the AIA, there is an "approximate nine to twelve month lag time between architecture billings and construction spending" on non-residential construction. So there will probably be further declines in CRE investment into 2011.
Moody's reported today that the Moody’s/REAL All Property Type Aggregate Index declined 3.1% in July. This is a repeat sales measure of commercial real estate prices.
Below is a comparison of the Moodys/REAL Commercial Property Price Index (CPPI) and the Case-Shiller composite 20 index.
Notes: Beware of the "Real" in the title - this index is not inflation adjusted. Moody's CRE price index is a repeat sales index like Case-Shiller - but there are far fewer commercial sales - and that can impact prices.
 CRE prices only go back to December 2000.
The Case-Shiller Composite 20 residential index is in blue (with Dec 2000 set to 1.0 to line up the indexes).
It is important to remember that the number of transactions is very low and there are a large percentage of distressed sales.
The index is now down 43.2% from the peak in October 2007. And the index is only 0.9% above the October 2009 low.
Best wishes to all.
Saturday, September 25, 2010
2010: The Year of the Short Sale
by Calculated Risk on 9/25/2010 10:58:00 PM
From Dina ElBoghdady and Dan Keating at the WaPo: Walking away with less. First some stats:
Completed short sales have more than tripled since 2008, and 400,000 of these deals are projected to close this year, according to mortgage research firm CoreLogic. ... Fannie Mae approved short sales on 36,534 home loans it owned in the first half of the year, nearly triple the number in 2007 and 2008 combined. Freddie Mac ... approved 22,117 in the first half of 2010, up from a mere 94 in the first half of 2007.The article has an interesting anecdote about a short sale buyer who bought in 2008, and is now selling ... as a short sale:
The original owner bought the home for $400,714 in 2006; Harris and her husband ... paid what seemed to be a bargain price, $289,000, in 2008. ... they have fallen behind on their mortgage payments ... Now they have a $246,000 offer for the home, and the balance on their mortgage is more than that.Knife catchers. Ouch.
New Home Sales: Lowest Median Price since 2003
by Calculated Risk on 9/25/2010 06:46:00 PM
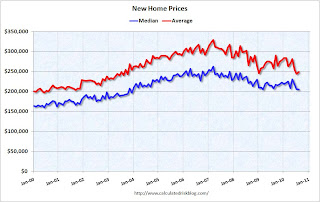
As part of the new home sales report, the Census Bureau reported that the median price for new homes fell to the lowest level since 2003.
 Click on graph for larger image in new window.
This graph shows the median and average new home price.
Some analysts pointed to the slight recovery in the median and average new home prices last year and into 2010 as evidence of the beginning of a recovery.
However in August, new home prices fell to the lowest level since 2003.
 The second graph shows the percent of new home sales by price.
Over 52% of all home sales were under $200K in August - the highest percentage since 2003. (update: nemo notes the the median is over $200K in the first graph - this is an issue with rounding).
And 82.6% of new home sales were under $300K - the highest percentage under $300K since August 2002. Only 17.4% of new homes sales were over $300K in August.
To summarize: Not only are new home sales near record lows (slightly above the record in May 2010 on a seasonally adjusted annual rate basis), but the median prices are back to 2003 levels. And there are very few homes being sold above $300K.
Dubai: See-through office buildings are still being completed
by Calculated Risk on 9/25/2010 02:45:00 PM
Just a Saturday visit to Dubai ...
From Richard Spencer at the Telegraph: Dubai may have to knock down buildings constructed during boom (ht Eyal)
The report [from property firm Jones Lang LaSalle] said that between the end of 2007 and the first half of 2010, the amount of office space available in the city grew by 140 per cent – more than double – to 48 million square feet. But the increase in the space occupied was only 70 per cent.Talk about over building! Demolishing completed buildings probably doesn't make sense (it is the desert and the buildings will last a long time with little maintenance). Maybe they can convert the buildings to other uses, but they already have too many high rise condos too.
There were still new tenants moving in, but with 19 million square feet coming available this year, and more in 2011 and 2012, the vacancy rate would increase further, from 38 per cent now to over 50 per cent outside the central business district.
Just imagine the impact on unemployment as these buildings are completed over the next couple of years. (update: most construction related jobs are held by immigrants - and I was referring to the unemployment of those workers).
Unofficial Problem Bank List increases to 872 institutions
by Calculated Risk on 9/25/2010 11:31:00 AM
Note: this is an unofficial list of Problem Banks compiled only from public sources.
Here is the unofficial problem bank list for September 24, 2010.
Changes and comments from surferdude808:
The Unofficial Problem Bank List underwent significant changes this week from failures and the FDIC releasing its enforcement actions for August 2010. The list finished the week at 872 institutions with assets of $422.4 billion, up from 854 institutions with assets of $416 billion last week.The list just keeps growing.
Changes this week include three removals and 21 additions. The removals are the two failures -- Haven Trust Bank Florida ($149 million) and North County Bank ($289 million) and one from an unassisted merger -- Sunrise Bank of Atlanta ($50 million).
Most notable among the additions are Lydian Private Bank, Palm Beach, FL ($1.96 billion); Universal Bank, West Covina, CA ($537 million); TruPoint Bank, Grundy, VA ($484 million); First Guaranty Bank and Trust Company of Jacksonville, Jacksonville, FL ($460 million); and First South Bank, Spartanburg, SC ($456 million Ticker: FSBS).
Other changes include Prompt Corrective Action Orders issued against Peoples State Bank ($445 million), LandMark Bank of Florida ($320 million), First Arizona Savings, a FSB ($272 million), American Patriot Bank ($108 million), and Idaho First Bank ($82 million).
WSJ: Committee to Save the Euro
by Calculated Risk on 9/25/2010 08:41:00 AM
An interesting back story in the WSJ: On the Secret Committee to Save the Euro, a Dangerous Divide
Two months after Lehman Brothers collapsed in the fall of 2008, a small group of European leaders set up a secret task force ... Its mission: Devise a plan to head off a default by a country in the 16-nation euro zone.And a year later - when Greece was near default - the committee hadn't agreed on a strategy. And that lead to the frantic last minute scramble to piece together a bailout for Greece - with Germany calling the shots.
Friday, September 24, 2010
Misc: Bernanke, "Toxie", GMAC, Credit Card debt and Housing
by Calculated Risk on 9/24/2010 10:46:00 PM
A few stories:
When we bought Toxie , in January of this year, she seemed like a great deal. We paid $1,000. That was 99 percent less than she cost dring the housing boom.And on the four housing reports this week: "Been down so long it looks like up to me", (book by Richard Fariña)
Every month, when homeowners paid their mortgages, we got a check. We thought we'd make back our investment before she died. But in the end, we collected only $449.
I'll have a weekly summary on Sunday.
Bank Failure #127: North County Bank, Arlington, Washington
by Calculated Risk on 9/24/2010 09:07:00 PM
From the FDIC: Whidbey Island Bank, Coupeville, Washington, Assumes All of the Deposits of North County Bank, Arlington, Washington
As of June 30, 2010, North County Bank had approximately $288.8 million in total assets and $276.1 million in total deposits. ... The FDIC estimates that the cost to the Deposit Insurance Fund (DIF) will be $72.8 million. ... North County Bank is the 127th FDIC-insured institution to fail in the nation this year, and the ninth in Washington.Just 2 this week? The unofficial problem bank list will be increasing ...
Bank Failure #126: Haven Trust Bank Florida, Ponte Vedra Beach, Florida
by Calculated Risk on 9/24/2010 05:29:00 PM
Too big of a bite was had
Indigestible
by Soylent Green is People
From the FDIC: First Southern Bank, Boca Raton, Florida, Assumes All of the Deposits of Haven Trust Bank Florida, Ponte Vedra Beach, Florida
As of June 30, 2010, Haven Trust Bank Florida had approximately $148.6 million in total assets and $133.6 million in total deposits. ... The FDIC estimates that the cost to the Deposit Insurance Fund (DIF) will be $31.9 million. ... Haven Trust Bank Florida is the 126th FDIC-insured institution to fail in the nation this year, and the twenty-fourth in Florida. The last FDIC-insured institution closed in the state was Horizon Bank, Bradenton, on September 10, 2010..


