by Calculated Risk on 5/02/2012 09:15:00 AM
Wednesday, May 02, 2012
LPS: March Foreclosure Starts increase, Foreclosure Sales lowest since December 2010
Note: U.S. District Court Judge Collyer approved the consent orders for the mortgage servicer settlement on April 5th, so we still have to wait a little longer to see the impact of the agreement on delinquencies.
LPS released their Mortgage Monitor report for March today.
According to LPS, 7.09% of mortgages were delinquent in March, down from 7.57% in February, and down from 7.78% in March 2011.
LPS reports that 4.14% of mortgages were in the foreclosure process, up slightly from 4.13% in February, and down slightly from 4.15% in March 2011.
This gives a total of 11.23% delinquent or in foreclosure. It breaks down as:
• 1,888,000 loans less than 90 days delinquent.
• 1,643,000 loans 90+ days delinquent.
• 2,060,000 loans in foreclosure process.
For a total of 5,591,000 loans delinquent or in foreclosure in March. This is down from 6,333,000 in March 2011.
This following graph shows the total delinquent and in-foreclosure rates since 1995.

The total delinquency rate has fallen to 7.09% from the peak in January 2010 of 10.97%. A normal rate is probably in the 4% to 5% range, so there is a long ways to go.
The in-foreclosure rate was at 4.14%, down from the record high in October 2011 of 4.29%. There are still a large number of loans in this category (about 2.06 million).

Every year some people fail to pay their mortgage during the holidays, and then they catch up by March. This graph shows the usual decline in the delinquency rate from December to March, and the decline in 2012 was about normal (in percentage terms).
The third graph shows the break down of loans "in foreclosure" by process (judicial vs. non-judicial).

The foreclosure inventory in non-judicial states is much lower and has been slowly declining.
The last graph (all provided by LPS Applied Analytics) shows foreclosure starts and sales.

Foreclosure sales were at their lowest point since December of 2010.
This was before the mortgage servicer settlement was approved in early April, so it is still too early to see the impact of the settlement.
There is much more in the Mortgage Monitor report.
ADP: Private Employment increased 119,000 in April
by Calculated Risk on 5/02/2012 08:18:00 AM
ADP reports:
Employment in the U.S. nonfarm private business sector increased by 119,000 from March to April on a seasonally adjusted basis. The estimated gain from February to March was revised down modestly, from the initial estimate of 209,000 to a revised estimate of 201,000.This was significantly below the consensus forecast of an increase of 178,000 private sector jobs in April. The BLS reports on Friday, and the consensus is for an increase of 165,000 payroll jobs in April, on a seasonally adjusted (SA) basis.
Employment in the private, service-providing sector increased 123,000 in April, after rising 158,000 in March. Employment in the private, goods-producing sector declined 4,000 jobs in April. Manufacturing employment dropped 5,000 jobs, the first loss since September of last year.
Note: ADP hasn't been very useful in predicting the BLS report, but this suggests a weaker than consensus report.
Tuesday, May 01, 2012
New Short Sales Guidelines from Fannie and Freddie
by Calculated Risk on 5/01/2012 08:09:00 PM
I mentioned this announcement two weeks ago - Kathleen Pender at the San Francisco Chronicle has more: New guidelines are a tall order for short sales
Fannie Mae and Freddie Mac have issued new guidelines designed to speed up short sales and make them more consistent, but real estate agents question whether they are achievable in the real world.This doesn't seem realistic, and there doesn't appear to be any penalty for missing the deadlines. But apparently Fannie and Freddie will track the performance of servicers, and maybe they will introduces penalties.
...
Under the new guidelines, which take effect June 15, servicers have 30 days to review and respond to short sale offers or requests. If they need more than 30 days, they must provide the borrower weekly updates and a final response within 60 days.
If the borrower is requesting a short sale under the government's Home Affordable Foreclosure Alternative program, the clock starts ticking when the borrower submits a completed borrower response package requesting consideration of a short sale.
...
If the short sale is not under the government program, the clock starts ticking when the borrower submits a short sale offer from a potential buyer and a completed borrower response package.
...
With the average short sale nationwide taking about six months to complete, real estate agents are happy to see the new timetable but wonder if it's realistic.
One of the key reasons for the slow approval process is the servicer wants to make sure the transaction is arms-length, and that there are no under the table consideration (extended lease, cash, etc.) and that the price is somewhat reasonable. And that takes time ...
U.S. Light Vehicle Sales at 14.42 million annual rate in April
by Calculated Risk on 5/01/2012 04:30:00 PM
Based on an estimate from Autodata Corp, light vehicle sales were at a 14.42 million SAAR in April. That is up 9.8% from April 2011, and up 0.7% from the sales rate last month (14.3 million SAAR in March 2012).
This was at the consensus forecast of 14.4 million SAAR (seasonally adjusted annual rate).
This graph shows the historical light vehicle sales from the BEA (blue) and an estimate for April (red, light vehicle sales of 14.42 million SAAR from Autodata Corp).
 Click on graph for larger image.
April was above the August 2009 rate with the spike in sales from "cash-for-clunkers". Only February had a higher sales rates since early 2008.
Sales are running at over a 14 million annual sales rate through the first four months of 2012, up sharply from the same period of 2011.
The second graph shows light vehicle sales since the BEA started keeping data in 1967.
 Note: dashed line is current estimated sales rate.
This shows the huge collapse in sales in the 2007 recession. This also shows the impact of the tsunami and supply chain issues on sales, especially in May and June of last year.
Construction Spending increases slightly in March
by Calculated Risk on 5/01/2012 12:09:00 PM
Catching up ... This morning the Census Bureau reported that overall construction spending increased slightly in March:
The U.S. Census Bureau of the Department of Commerce announced today that construction spending during March 2012 was estimated at a seasonally adjusted annual rate of $808.1 billion, 0.1 percent (±1.4%) above the revised February estimate of $807.3 billion. The March figure is 6.0 percent (±1.9%) above the March 2011 estimate of $762.6 billion.Private construction spending increased while public spending decreased:
Spending on private construction was at a seasonally adjusted annual rate of $531.9 billion, 0.7 percent (±1.3%) above the revised February estimate of $528.1 billion. Residential construction was at a seasonally adjusted annual rate of $244.1 billion in March, 0.7 percent (±1.3%) above the revised February estimate of $242.5 billion. Nonresidential construction was at a seasonally adjusted annual rate of $287.8 billion in March, 0.7 percent (±1.3%) above the revised February estimate of $285.7 billion.
 Click on graph for larger image.
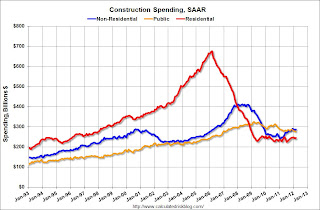
This graph shows private residential and nonresidential construction spending, and public spending, since 1993. Note: nominal dollars, not inflation adjusted.
Private residential spending is 64% below the peak in early 2006, and up 8.4% from the recent low. Non-residential spending is 30% below the peak in January 2008, and up about 18% from the recent low.
Public construction spending is now 15% below the peak in March 2009 and at a new post-bubble low.
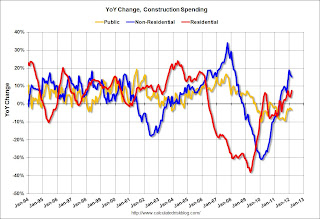
 The second graph shows the year-over-year change in construction spending.
On a year-over-year basis, both private residential and non-residential construction spending are positive, but public spending is down on a year-over-year basis. The year-over-year improvements in private non-residential are mostly due to energy spending (power and electric).
The year-over-year improvement in private residential investment is an important change (the positive in 2010 was related to the tax credit), and this suggest the bottom is in for residential investment.
ISM Manufacturing index indicates faster expansion in April
by Calculated Risk on 5/01/2012 10:09:00 AM
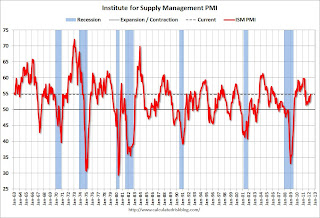
PMI was at 54.8% in April, up from 53.4% in March. The employment index was at 57.3%, up from 56.1%, and new orders index was at 58.2%, up from 54.5%.
From the Institute for Supply Management: April 2012 Manufacturing ISM Report On Business®
Economic activity in the manufacturing sector expanded in April for the 33rd consecutive month, and the overall economy grew for the 35th consecutive month, say the nation's supply executives in the latest Manufacturing ISM Report On Business®.
The report was issued today by Bradley J. Holcomb, CPSM, CPSD, chair of the Institute for Supply Management™ Manufacturing Business Survey Committee. "The PMI registered 54.8 percent, an increase of 1.4 percentage points from March's reading of 53.4 percent, indicating expansion in the manufacturing sector for the 33rd consecutive month. Sixteen of the 18 industries reflected overall growth in April, and the New Orders, Production and Employment Indexes all increased, indicating growth at faster rates than in March. The Prices Index for raw materials remained at 61 percent in April, the same rate as reported in March. Comments from the panel generally indicate stable to strong demand, with some concerns cited over increasing oil prices and European stability."
 Click on graph for larger image.
Here is a long term graph of the ISM manufacturing index.
This was above expectations of 53.0%. This suggests manufacturing expanded at a faster rate in April than in March. It appears manufacturing employment expanded faster in April with the employment index at 57.3%.
CoreLogic: 69,000 completed foreclosures in March 2012
by Calculated Risk on 5/01/2012 09:32:00 AM
From CoreLogic: CoreLogic® Reports 69,000 Completed Foreclosures Nationally in March
CoreLogic ... today released its National Foreclosure Report for March, which provides monthly data on completed foreclosures, foreclosure inventory and 90+ day delinquency rates. There were 69,000 completed foreclosures in March 2012 compared to 85,000 in March 2011 and 66,000 in February 2012. Through the first quarter of 2012, there were 198,000 completed foreclosures compared to 232,000 through the first quarter of 2011. Since the start of the financial crisis in September 2008, there have been approximately 3.5 million completed foreclosures.This is a new monthly report and will help track the number of completed foreclosures, and to see if the lenders are starting to clear the foreclosure inventory backlog following the mortgage settlement.
Approximately 1.4 million homes, or 3.4 percent of all homes with a mortgage, were in the national foreclosure inventory as of March 2012 compared to 1.5 million, or 3.5 percent, in March 2011 and 1.4 million, or 3.4 percent, in February 2012. The number of loans in the foreclosure inventory decreased by nearly 100,000, or 6.0 percent, in March 2012 compared to March 2011.
"The overall delinquency level was unchanged in March, remaining at its lowest point since July 2009," said Mark Fleming, chief economist for CoreLogic. "Non-judicial foreclosure markets like Nevada, Arizona, and California are experiencing significant improvements in their shares of delinquent borrowers. Some judicial foreclosure states are also improving, like Florida, but not to the extent of non-judicial markets."
...
"Compared to a year ago, the number of completed foreclosures has slowed," said Anand Nallathambi, chief executive officer of CoreLogic. "Since the foreclosure inventory is also coming down, this suggests that loan modifications, short sales, deeds-in-lieu are increasingly being used as an alternative to foreclosures to clear distressed assets in our communities."
So far we haven't seen a surge in completed foreclosures - or a large increase in REO (lender Real Estate Owned) coming on the market. The foreclosure inventory is also declining (properties in the foreclosure process), although the decline is slow according to recent LPS data. My guess is the "surge" in foreclosures will be less than many people expect (see from two weeks ago: Some thoughts on housing and foreclosures).
Chrysler: U.S. April sales increased 20% year-over-year
by Calculated Risk on 5/01/2012 08:37:00 AM
From Retuers: Chrysler April US Sales Jump 20 Percent
Chrysler Group's U.S. new-vehicle sales rose 20 percent last month, marking the best April performance in four yearsThe key number for the economy is the seasonally adjusted annual sales rate (SAAR) compared to the last few months, not the year-over-year comparison provided by the automakers. Once all the reports are released, I'll post a graph of the estimated total April light vehicle sales (SAAR) - usually around 4 PM ET.
...
The U.S. automaker said it expects the April annual selling rate for the industry to finish at 14.6 million vehicles. That would be stronger than the 14.4 million 41 analysts surveyed by Thomson Reuters had forecast and would also top the March rate of 14.4 million.
The consensus is for an increase to 14.4 million SAAR, from 14.3 million in March.
I'll add the reports from the other major auto companies as updates to this post.
Monday, April 30, 2012
Contest Questions and April Winner
by Calculated Risk on 4/30/2012 09:59:00 PM
For the question contest in April, the leaders were:
1) Bill (Calculated Risk)
2) Liye Ma
3) (4 way tie) Billy Forney (Finished 2nd in March)
3) Eggert Ólafsson
3) Makesh Pravin
3) Rik Osmer
Congratulations to all.
For fun I've added a monthly question contest on the right sidebar. It takes a Facebook login. Contestants receive 1 point for each correct answer. At the end of each month, I list the leaders in a post on the blog.
Here are the questions for this week (2 on Tuesday, 1 on Thursday, 2 on Friday):
Restaurant Performance Index increases in March
by Calculated Risk on 4/30/2012 07:04:00 PM
From the National Restaurant Association: Restaurant Performance Index Closes Out Q1 at Post-Recession High
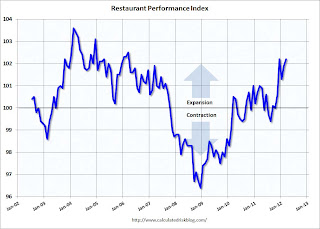
Driven by solid same-store sales and traffic results and an increasingly bullish outlook among restaurant operators, the National Restaurant Association’s Restaurant Performance Index (RPI) matched its post-recession high in March. The RPI – a monthly composite index that tracks the health of and outlook for the U.S. restaurant industry – stood at 102.2 in March, up 0.3 percent from February and equaling its post-recession high that was previously reached in December 2011.
“The first quarter finished strong with a solid majority of restaurant operators reporting higher same-store sales and customer traffic levels in March,” said Hudson Riehle, senior vice president of the Research and Knowledge Group for the Association. “In addition, restaurant operators are solidly optimistic about sales growth and the economy in the months ahead, which propelled the Expectations component of the RPI to its highest level in 15 months.”
“Bolstered by improving sales and traffic results, restaurant operators’ outlook for capital spending reached its highest level in more than four years,” Riehle added. “This will have positive implications throughout the supply chain of the restaurant industry.”
 Click on graph for larger image.
The index increased to 102.2 in March, up from 101.9 in February (above 100 indicates expansion).
Restaurant spending is discretionary, so even though this is "D-list" data, I like to check it every month - and the index was fairly strong in March.


