by Calculated Risk on 9/10/2014 02:29:00 PM
Wednesday, September 10, 2014
Vehicle Sales: Fleet Turnover Ratio
Back in early 2009, I wrote a couple of posts arguing there would be an increase in auto sales - Vehicle Sales (Jan 2009) and Looking for the Sun (Feb 2009). This was an out-of-the-consensus call and helped me call the bottom for the US economy in mid-2009.
Here is an update to the U.S. fleet turnover graph.
This graph shows the total number of registered vehicles in the U.S. divided by the sales rate through August 2014 - and gives a turnover ratio for the U.S. fleet (this doesn't tell you the age or the composition of the fleet). Note: the number of registered vehicles is estimated for 2012 through 2014.
The wild swings in 2009 were due to the "cash for clunkers" program.

The estimated ratio for August was just over 14 years - back to a more normal level.
Note: I argued the turnover ratio would "probably decline to 15 or so eventually" and that has happened.

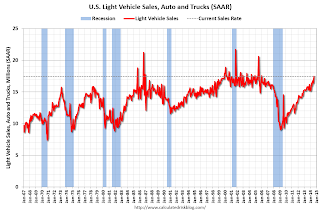
The current sales rate is now near the top (excluding one month spikes) of the '98/'06 auto boom.
Light vehicle sales were at a 17.45 million seasonally adjusted annual rate (SAAR) in August.
I now expect vehicle sales to mostly move sideways over the next few years.
FNC: Residential Property Values increased 7.4% year-over-year in July
by Calculated Risk on 9/10/2014 10:58:00 AM
In addition to Case-Shiller, and CoreLogic, I'm also watching the FNC, Zillow and several other house price indexes.
FNC released their July index data today. FNC reported that their Residential Price Index™ (RPI) indicates that U.S. residential property values increased 0.6% from June to July (Composite 100 index, not seasonally adjusted). The other RPIs (10-MSA, 20-MSA, 30-MSA) increased between 0.4% and 0.6% in July. These indexes are not seasonally adjusted (NSA), and are for non-distressed home sales (excluding foreclosure auction sales, REO sales, and short sales).
The year-over-year (YoY) change slowed in July, with the 100-MSA composite up 7.4% compared to July 2013. For FNC, the YoY increase has been slowing since peaking in February at 9.4%.
The index is still down 19.5% from the peak in 2006.

This graph shows the year-over-year change based on the FNC index (four composites) through July 2014. The FNC indexes are hedonic price indexes using a blend of sold homes and real-time appraisals.
All of the price indexes are now showing a slowdown in price increases.
The July Case-Shiller index will be released on Tuesday, September 30th, and I expect Case-Shiller to show a further slowdown in YoY price increases.
MBA: Mortgage Applications Decrease in Latest MBA Weekly Survey, Refinance Activity Lowest since 2008
by Calculated Risk on 9/10/2014 07:01:00 AM
From the MBA: Mortgage Applications Decrease in Latest MBA Weekly Survey
Mortgage applications decreased 7.2 percent from one week earlier, according to data from the Mortgage Bankers Association’s (MBA) Weekly Mortgage Applications Survey for the week ending September 5, 2014. This week’s results included an adjustment for the Labor Day holiday. ...
The Refinance Index decreased 11 percent from the previous week, to the lowest level since November 2008. The seasonally adjusted Purchase Index decreased 3 percent from one week earlier, to the lowest level since February 2014. ...
...
The average contract interest rate for 30-year fixed-rate mortgages with conforming loan balances ($417,000 or less) increased to 4.27 percent, the first increase in four weeks, from 4.25 percent, with points increasing to 0.25 from 0.24 (including the origination fee) for 80 percent loan-to-value ratio (LTV) loans.
emphasis added
 Click on graph for larger image.
The first graph shows the refinance index.
The refinance index is down 76% from the levels in May 2013 and at the lowest level since 2008.
As expected, refinance activity is very low this year.
 The second graph shows the MBA mortgage purchase index.
 According to the MBA, the unadjusted purchase index is down about 12% from a year ago.
Tuesday, September 09, 2014
Update: Framing Lumber Prices
by Calculated Risk on 9/09/2014 08:59:00 PM
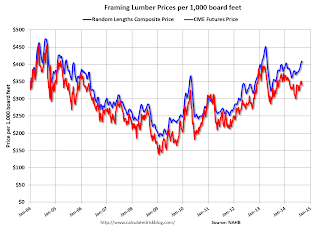
Here is another graph on framing lumber prices. Early in 2013 lumber prices came close to the housing bubble highs. Then prices declined over 25% from the highs by mid-year 2013.
The price increases in early 2013 were due to a surge in demand (more housing starts) and supply constraints (framing lumber suppliers were working to bring more capacity online).
Prices didn't increase as much early in 2014 (more supply, smaller "surge" in demand), however prices haven't fallen as sharply either.

This graph shows two measures of lumber prices: 1) Framing Lumber from Random Lengths through last week (via NAHB), and 2) CME framing futures.
Right now Random Lengths prices are up about 12% from a year ago, and CME futures are up about 4% year-over-year.
Las Vegas Real Estate in August: YoY Non-contingent Inventory up 39%, Distressed Sales and Cash Buying down YoY
by Calculated Risk on 9/09/2014 02:39:00 PM
This is a key distressed market to follow since Las Vegas has seen the largest price decline of any of the Case-Shiller composite 20 cities.
The Greater Las Vegas Association of Realtors reported GLVAR reports local home prices holding steady, fewer cash buyers
According to GLVAR, the total number of existing local homes, condominiums and townhomes sold in August was 3,120, down from 3,314 in July and down from 3,539 one year ago.There are several key trends that we've been following:
GLVAR said 32.1 percent of all existing local homes sold in August were purchased with cash. That’s down from 35.6 percent in July, near a five-year low and well short of the February 2013 peak of 59.5 percent, suggesting that fewer investors are buying homes in Southern Nevada.
...
Since 2013, GLVAR has reported fewer distressed sales and more traditional home sales, where lenders are not controlling the transaction. That trend continued in August, when GLVAR reported that 11.5 percent of all sales were short sales – which occur when lenders allow borrowers to sell a home for less than what they owe on the mortgage. That matched the percentage of short sales in July. Another 8.9 percent of all August sales were bank-owned properties, down from 9.1 percent in July.
...
The total number of single-family homes listed for sale on GLVAR’s Multiple Listing Service in August was 13,752, up 0.3 percent from 13,717 in July, but down 5.0 percent from one year ago. ...
By the end of August, GLVAR reported 7,788 single-family homes listed without any sort of offer. That’s up 7.2 percent from 7,266 such homes listed in July, and a 38.8 percent jump from one year ago.
emphasis added
1) Overall sales were down about 12% year-over-year.
2) Conventional (equity, not distressed) sales were up 5% year-over-year. In August 2013, only 67.0% of all sales were conventional equity. This year, in August 2014, 79.6% were equity sales.
3) The percent of cash sales has declined year-over-year from 52.5% in August 2013 to 32.1% in August 2014. (investor buying appears to be declining).
4) Non-contingent inventory is up 38.8% year-over-year.
More inventory (a major theme for 2014) suggests price increases will slow.
Trulia: Asking House Prices up 7.8% year-over-year in August
by Calculated Risk on 9/09/2014 12:09:00 PM
From Trulia chief economist Jed Kolko: Slow and Steady Now Winning the Home-Price Race
Nationally, the month-over-month increase in asking home prices rose to 1.0% in August, up a bit from 0.7% in July. Asking prices rose 7.8% year-over-year, slower than one year ago, in August 2013, when asking prices were up 9.9% year-over-year. At the local level, asking prices rose year-over-year in 96 of the 100 largest U.S. metros.Note: These asking prices are SA (Seasonally Adjusted) - and adjusted for the mix of homes - and this suggests further house price increases over the next few months on a seasonally adjusted basis.
...
Foreclosures have shaped where and when home prices have recovered. Foreclosed homes tend to depress neighboring home values and sell at a discount. But once most of the foreclosures in a market are sold, then overall inventory tightens – especially at the low end – giving home prices a boost. In states with a “non-judicial” foreclosure process (such as California, Michigan, and Texas), foreclosures don’t have to go through the courts. That means homes in non-judicial states are foreclosed and sold more quickly than in states with a “judicial” process (such as Florida, Illinois, and New York). As a result, the foreclosure wave cleared sooner and faster in non-judicial states, and housing markets in those states got an earlier and sharper price boost.
But now, even judicial states are seeing the light at the end of the foreclosure tunnel and are getting their own price boost. In August 2014, asking prices on for-sale homes excluding foreclosures were up 6.9% year-over-year in metros in judicial states, only slightly behind the 7.8% increase in metros in non-judicial states. In contrast, in August 2013, the year-over-year price gain was 14.1% in non-judicial states and just 5.1% in judicial states.
...
Rents Accelerate, Rising 6.3% Year-over-Year
In five of the 25 largest rental markets, rents rose more than 10% year-over-year. Three of these five are in northern California: Sacramento, San Francisco, and Oakland have the highest rent increases in the country, followed by Denver and Miami. Rents rose faster year-over-year in August than three months ago, in May, in 20 of the 25 largest rental markets. In August compared to May, rents accelerated most in Sacramento while cooling in San Diego.
emphasis added
BLS: Jobs Openings at 4.7 million in July, Up 22% Year-over-year
by Calculated Risk on 9/09/2014 10:00:00 AM
From the BLS: Job Openings and Labor Turnover Summary
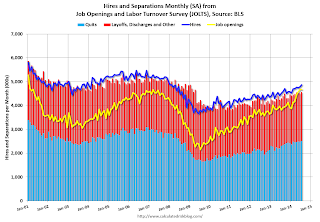
here were 4.7 million job openings on the last business day of July, little changed from June, the U.S. Bureau of Labor Statistics reported today. ...The following graph shows job openings (yellow line), hires (dark blue), Layoff, Discharges and other (red column), and Quits (light blue column) from the JOLTS.
...
Quits are generally voluntary separations initiated by the employee. Therefore, the quits rate can serve as a measure of workers’ willingness or ability to leave jobs. ... The number of quits was little changed in July at 2.5 million.
This series started in December 2000.
Note: The difference between JOLTS hires and separations is similar to the CES (payroll survey) net jobs headline numbers. This report is for July, the most recent employment report was for August.
 Click on graph for larger image.
Note that hires (dark blue) and total separations (red and light blue columns stacked) are pretty close each month. This is a measure of labor market turnover. When the blue line is above the two stacked columns, the economy is adding net jobs - when it is below the columns, the economy is losing jobs.
Jobs openings decreased slightly in July to 4.673 million from 4.675 million in June.
The number of job openings (yellow) are up 22% year-over-year compared to July 2013.
Quits are up 9% year-over-year and are at the highest level since 2008. These are voluntary separations. (see light blue columns at bottom of graph for trend for "quits").
It is a good sign that job openings are over 4 million for the sixth consecutive month, and that quits are increasing.
NFIB: Small Business Optimism Index increases in August
by Calculated Risk on 9/09/2014 08:12:00 AM
From the National Federation of Independent Business (NFIB): NFIB SBET Sees Slight Bump in August
August’s Optimism Index rose 0.4 points to 96.1 making it the second highest reading since October, 2007. ...Hiring plans decreased to 10.
NFIB owners increased employment by an average of 0.02 workers per firm in August (seasonally adjusted), the eleventh positive month in a row but basically a “zero” net gain. emphasis added
And in a positive sign, the percent of firms reporting "poor sales" as the single most important problem has fallen to 13, down from 17 last year - and "taxes" and "regulations" are the top problems at 22 (taxes are usually reported as the top problem during good times).
 Click on graph for larger image.
This graph shows the small business optimism index since 1986.
The index increased to 96.1 in August from 95.7 in July.
Note: There is high percentage of real estate related businesses in the "small business" survey - and this has held down over all optimism.
Monday, September 08, 2014
Tuesday: Job Openings, Small Business Survey
by Calculated Risk on 9/08/2014 06:20:00 PM
From Nick Timiraos at the WSJ: Why More Renters Aren’t Buying (Hint: Weak Incomes, Savings)
A new survey says that younger workers and other renters aren’t turning away from homeownership because they lack the desire to own homes. Instead, they’re staying on the sidelines because they lack the capacity to purchase.My view is people will want to own ... and as their incomes eventually increase, they will become homeowners. No worries.
The analysis from the New York Federal Reserve Bank comes via their survey of consumer expectations in February. It polled 867 homeowners and 344 renters on their attitudes toward homeownership and their plans to move.
One popular trend cited frequently in the press is that millennials and other renters have permanently turned away from owning homes after watching their parents’ generation take it on the chin during the housing bust. ...
But the New York Fed researchers say their survey points to a different conclusion: borrowers want to buy, but they can’t cut it financially. Conservative mortgage lending standards are only likely to exacerbate this problem.
Tuesday:
• At 7:30 AM ET, the NFIB Small Business Optimism Index for August.
• Early, the Trulia Price Rent Monitors for August. This is the index from Trulia that uses asking house prices adjusted both for the mix of homes listed for sale and for seasonal factors.
• At 10:00 AM, Job Openings and Labor Turnover Survey for July from the BLS. Jobs openings increased in June to 4.671 million from 4.577 million in May. That was the highest level since February 2001. The number of job openings were up 18% year-over-year compared to June 2013. Quits were up 15% year-over-year in June.
Duy on Fed's "considerable time" phrase
by Calculated Risk on 9/08/2014 01:47:00 PM
From Tim Duy at Economist's View: Forward Guidance Heading for a Change
The lackluster August employment report clearly defied expectations (including my own) for a strong number to round out the generally positive pattern of recent data. That said, one number does not make a trend, and the monthly change in nonfarm payrolls is notoriously volatile. The underlying pattern of improvement remains in tact, and thus the employment report did not alleviate the need to adjust the Fed's forward guidance, allow there is a less pressing need to do so at the next meeting. In any event, the days of the "considerable time" language are numbered.CR Note: The next FOMC meeting is on Sept 16th and 17th. Duy is referring to these sentences in the FOMC statement:
...
Arguably the only trend that is markedly different is the more rapid decline in long-term unemployment, a positive cyclical indicator. Labor force participation remains subdued, although the Fed increasing views that as a structural issue. Average wage growth remained flat while wages for production workers accelerated slightly to 2.53% over the past year. A postive development to be sure, but too early to declare a sustained trend.
The notable absence of any bad news in the labor report leaves the door open to changing the forward guidance at the next FOMC meeting. ...
...
The trick is to change the language without suggesting the timing of the first rate hike is necessarily moving forward. The benefit of the next meeting is that it includes updated projections and a press conference. Stable policy expectations in those projections would create a nice opportunity to change the language. Moreover, Yellen would be able to to further explain any changes at that time. This also helps set the stage for the end of asset purchases in October. A shift in the guidance next week has a lot to offer.
Bottom Line: The US economy is moving to a point in the cycle in which monetary policymakers have less certainty about the path of rates. Perhaps they need to be pulled forward, perhaps pushed back. Policymakers will need to be increasingly pragmatic, to use Yellen's term, when assessing the data. The "considerable time" language is inconsistent with such a pragmatic approach. It is hard to see that such language survives more than another FOMC statement. Seems to be data and policy objections are not the impediments preventing a change in the guidance, but instead the roadblock is the ability to reach agreement on new language in the next ten days.
emphasis added
"In determining how long to maintain the current 0 to 1/4 percent target range for the federal funds rate, the Committee will assess progress--both realized and expected--toward its objectives of maximum employment and 2 percent inflation. This assessment will take into account a wide range of information, including measures of labor market conditions, indicators of inflation pressures and inflation expectations, and readings on financial developments. The Committee continues to anticipate, based on its assessment of these factors, that it likely will be appropriate to maintain the current target range for the federal funds rate for a considerable time after the asset purchase program ends, especially if projected inflation continues to run below the Committee's 2 percent longer-run goal, and provided that longer-term inflation expectations remain well anchored."


