by Calculated Risk on 9/24/2014 01:59:00 PM
Wednesday, September 24, 2014
Comments on New Home Sales
The new home sales report for August was above expectations at 504 thousand on a seasonally adjusted annual rate basis (SAAR). This was the highest sales rate since May 2008. However, we need to remember this was just one month of data.
Also sales for the previous three months were revised up a combined 16,000 sales SAAR.
The Census Bureau reported that new home sales this year, through August, were 307,000, Not seasonally adjusted (NSA). That is up 2.7% from 299,000 during the same period of 2013 (NSA). Not much of a gain from last year. Right now it looks like sales will barely be up this year (maybe 3% or so for the year).
Sales were up 33.0% year-over-year in August - however sales declined sharply in Q3 2013 as mortgage rates increased - so this was an easy comparison. The comparison for September will be pretty easy too.

This graph shows new home sales for 2013 and 2014 by month (Seasonally Adjusted Annual Rate).
The comparisons to last year are easy right now, and I expect to see year-over-year growth for the 2nd half of 2014.
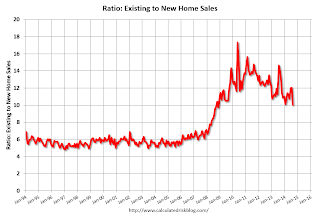
And here is another update to the "distressing gap" graph that I first started posting several years ago to show the emerging gap caused by distressed sales. Now I'm looking for the gap to close over the next few years.

Following the housing bubble and bust, the "distressing gap" appeared mostly because of distressed sales.
I expect existing home sales to decline or move sideways (distressed sales will continue to decline and be partially offset by more conventional / equity sales). And I expect this gap to slowly close, mostly from an increase in new home sales.

This ratio was fairly stable from 1994 through 2006, and then the flood of distressed sales kept the number of existing home sales elevated and depressed new home sales. (Note: This ratio was fairly stable back to the early '70s, but I only have annual data for the earlier years).
In general the ratio has been trending down, and this ratio will probably continue to trend down over the next several years.
Note: Existing home sales are counted when transactions are closed, and new home sales are counted when contracts are signed. So the timing of sales is different.
AIA: "Architecture Billings Index Exhibits Continued Strength" in August
by Calculated Risk on 9/24/2014 11:25:00 AM
Note: This index is a leading indicator primarily for new Commercial Real Estate (CRE) investment.
From AIA: Architecture Billings Index Exhibits Continued Strength
On the heels of recording its strongest pace of growth since 2007, there continues to be an increasing level of demand for design services signaled in the latest Architecture Billings Index (ABI). As a leading economic indicator of construction activity, the ABI reflects the approximate nine to twelve month lead time between architecture billings and construction spending. The American Institute of Architects (AIA) reported the August ABI score was 53.0, down from a mark of 55.8 in July. This score reflects an increase in design activity (any score above 50 indicates an increase in billings). The new projects inquiry index was 62.6, following a very strong mark of 66.0 the previous month.
The AIA has added a new indicator measuring the trends in new design contracts at architecture firms that can provide a strong signal of the direction of future architecture billings. The score for design contracts in August was 56.9.
“One of the key triggers for accelerating growth at architecture firms is that long-stalled construction projects are starting to come back to life in many areas across the country,” said AIA Chief Economist Kermit Baker, Hon. AIA, PhD. “Long awaited access to credit from lending institutions and an increasing comfort level in the overall economy has helped revitalize the commercial real estate sector in recent months. Additionally, though, a crucial component to a broader industry-wide recovery is the emerging demand for new projects such as education facilities, government buildings and, in some cases, hospitals.”
• Regional averages: Northeast (58.1) , South (55.1), West (52.5), Midwest (51.0) [three month average]
emphasis added
 Click on graph for larger image.
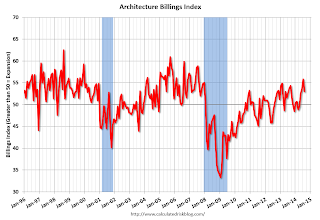
This graph shows the Architecture Billings Index since 1996. The index was at 53.0 in August, down from 55.8 in July. Anything above 50 indicates expansion in demand for architects' services.
Note: This includes commercial and industrial facilities like hotels and office buildings, multi-family residential, as well as schools, hospitals and other institutions.
According to the AIA, there is an "approximate nine to twelve month lag time between architecture billings and construction spending" on non-residential construction. So the readings over the last year suggest an increase in CRE investment this year and in 2015.
New Home Sales increase to 504,000 Annual Rate in August, Highest Sales Rate since May 2008
by Calculated Risk on 9/24/2014 10:00:00 AM
The Census Bureau reports New Home Sales in August were at a seasonally adjusted annual rate (SAAR) of 504 thousand.
July sales were revised up from 412 thousand to 427 thousand, and June sales were revised down from 422 thousand to 419 thousand.
"Sales of new single-family houses in August 2014 were at a seasonally adjusted annual rate of 504,000, according to estimates released jointly today by the U.S. Census Bureau and the Department of Housing and Urban Development. This is 18.0 percent above the revised July rate of 427,000 and is 33.0 percent above the August 2013 estimate of 379,000."
 Click on graph for larger image.
The first graph shows New Home Sales vs. recessions since 1963. The dashed line is the current sales rate.
Even with the increase in sales over the previous two years, new home sales are still close to the bottom for previous recessions.
The second graph shows New Home Months of Supply.
 The months of supply decreased in August to 4.8 months from 5.6 months in July.
 The all time record was 12.1 months of supply in January 2009.
This is now in the normal range (less than 6 months supply is normal).
"The seasonally adjusted estimate of new houses for sale at the end of August was 203,000. This represents a supply of 4.8 months at the current sales rate."
 On inventory, according to the Census Bureau:
 "A house is considered for sale when a permit to build has been issued in permit-issuing places or work has begun on the footings or foundation in nonpermit areas and a sales contract has not been signed nor a deposit accepted."Starting in 1973 the Census Bureau broke this down into three categories: Not Started, Under Construction, and Completed.
The third graph shows the three categories of inventory starting in 1973.
The inventory of completed homes for sale is still low, and the combined total of completed and under construction is also low.
 The last graph shows sales NSA (monthly sales, not seasonally adjusted annual rate).
In August 2014 (red column), 41 thousand new homes were sold (NSA). Last year 31 thousand homes were also sold in August. This was the best August since 2007.
The high for August was 110 thousand in 2005, and the low for August was 23 thousand in 2010.
This was well above expectations of 430,000 sales in August, and sales were up 33.0% year-over-year.
I'll have more later today.
MBA: Mortgage Applications Decrease in Latest MBA Weekly Survey
by Calculated Risk on 9/24/2014 07:01:00 AM
From the MBA: Mortgage Applications Decrease in Latest MBA Weekly Survey
Mortgage applications decreased 4.1 percent from one week earlier, according to data from the Mortgage Bankers Association’s (MBA) Weekly Mortgage Applications Survey for the week ending September 19, 2014. ...
The Refinance Index decreased 7 percent from the previous week. The seasonally adjusted Purchase Index decreased 0.3 percent from one week earlier. ...
...
The average contract interest rate for 30-year fixed-rate mortgages with conforming loan balances ($417,000 or less) increased to 4.39 percent, the highest rate since May 2014, from 4.36 percent, with points increasing to 0.35 from 0.20 (including the origination fee) for 80 percent loan-to-value ratio (LTV) loans..
emphasis added
 Click on graph for larger image.
The first graph shows the refinance index.
The refinance index is down 76% from the levels in May 2013.
As expected, refinance activity is very low this year.
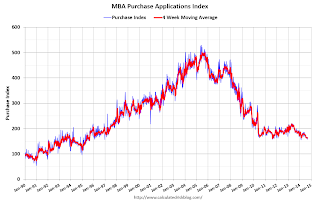
 The second graph shows the MBA mortgage purchase index.
 According to the MBA, the unadjusted purchase index is down about 16% from a year ago.
Tuesday, September 23, 2014
Wednesday: New Home Sales
by Calculated Risk on 9/23/2014 07:44:00 PM
From Matthew Klein at FT Alphaville: Fix housing finance, fix the economy?
Oscar Jorda, Moritz Schularick, and Alan Taylor have just come out with a paper on the increasingly important role that real estate, particularly residential real estate, has come to play in the financial systems of rich countries.In 2005, when I started this blog, I argued that housing was 1) in a bubble, and 2) was the key to the business cycle (so the bursting bubble would lead to a recession). Professor Ed Leamer argued in 2007 that "Housing Is the Business Cycle"! The good news is this suggests the recovery should continue.
The trio previously collaborated on a comprehensive study of every rich-world business cycle since 1870, which found that the rate of private credit growth during an economic expansion helped predict the likelihood of financial crisis and directly corresponded to the severity of the subsequent downturn even in cases when there was no financial crisis ...
The new paper covers a slightly longer period and somewhat larger set of countries, but the biggest improvement is its distinction of different types of credit and different categories of borrowers. Their basic finding is that it was mortgage lending rather than lending to businesses or consumer credit that can explain the enormous increase in total bank credit (a decent proxy for overall financialisation) over the past 35 years ...
Wednesday:
• At 7:00 AM ET, the Mortgage Bankers Association (MBA) will release the results for the mortgage purchase applications index.
• At 10:00 AM, New Home Sales for August from the Census Bureau. The consensus is for an increase in sales to 430 thousand Seasonally Adjusted Annual Rate (SAAR) in August from 412 thousand in July.
• During the day, the AIA's Architecture Billings Index for August (a leading indicator for commercial real estate).
ATA Trucking Index increased 1.6% in August
by Calculated Risk on 9/23/2014 04:30:00 PM
Here is a minor indicator that I follow, from ATA: ATA Truck Tonnage Index Increased 1.6% in August to New Record High
American Trucking Associations’ advanced seasonally adjusted For-Hire Truck Tonnage Index increased 1.6% in August, following a gain of 1.5% the previous month. In August, the index equaled 132.6 (2000=100) versus 130.5 in July. August’s index is the highest on record, surpassing November 2013 (131.0).
Compared with August 2013, the SA index increased 4.5%, up from July’s 3.7% year-over-year gain. The latest year-over-year increase was the largest this year. Year-to-date, compared with the same period last year, tonnage is up 3.1%. ...
“After a strong July, factory production and housing starts fell in August on a month-to-month basis,” said ATA Chief Economist Bob Costello. “Truck tonnage actually did the opposite. Not only did it increase, it accelerated.”
Costello stated that tonnage is up 3.1% over the last two months alone and has surged 6.8% since hitting a recent low in January.
“I’m optimistic about the second half of the year for the economy, which means truck tonnage should do well too,” he said.
emphasis added
 Click on graph for larger image.
Here is a long term graph that shows ATA's For-Hire Truck Tonnage index.
The dashed line is the current level of the index.
The index is now up 4.5% year-over-year.
Chemical Activity Barometer "Pace of Growth Slows for Leading Economic Indicator"
by Calculated Risk on 9/23/2014 12:49:00 PM
Here is a new indicator that I'm following that appears to be a leading indicator for industrial production.
From the American Chemistry Council: Pace of Growth Slows for Leading Economic Indicator for Second Consecutive Month
The Chemical Activity Barometer (CAB), a leading economic indicator created by the American Chemistry Council (ACC), continued to see an easing of growth this month, with a 0.1 percent gain over August as measured on a three-month moving average (3MMA). Growth for the third quarter stands at an average monthly gain of 0.2 percent compared to the strong 0.5 percent monthly average during the first half of the year. Despite the softening pace, the September CAB marked a string of consecutive gains going back to July 2012. Though the pace of growth has slowed, current gains have the CAB up a healthy 3.9 percent over this time last year, and the barometer remains at its highest level since January 2008. ...
Though the production indicator was flat in September, construction-related coatings, pigments and other performance chemistries remained strong, despite last week’s weak housing report. Chemical equities were up sharply this month, continuing to outpace the broader market. New orders and inventories improved in September but at a slower pace than earlier months.
emphasis added
 Click on graph for larger image.
This graph shows the year-over-year change in the 3-month moving average for the Chemical Activity Barometer compared to Industrial Production. It does appear that CAB (red) generally leads Industrial Production (blue).
And this suggests continued growth.
Richmond Fed: "Manufacturing conditions strengthened in September"
by Calculated Risk on 9/23/2014 10:03:00 AM
From the Richmond Fed: Manufacturing Sector Activity Grew Moderately; Employment Improved, Average Wages Edged Down
Overall, manufacturing conditions strengthened in September. The composite index for manufacturing moved to a reading of 14 following last month's reading of 12. The index for shipments edged up one point, ending at 11, while the index for new orders also gained one point, finishing at a reading of 14. ...Another solid regional manufacturing report for September.
Manufacturing employment picked up this month; the September index advanced six points ending at 17. The average workweek lengthened, moving the index up two points to end at 10. However, average wages slowed somewhat compared to a month ago, with that index ending two points below the previous month at 9.
Producers remained positive about business conditions for the six months ahead. They expected solid growth in shipments and in the volume of new orders. The indexes for expected shipments and new orders ended at readings of 41 and 37, respectively, slightly below their outlook of a month ago.
emphasis added
FHFA: House Prices increase 0.1% in July, Up 4.4% Year-over-year
by Calculated Risk on 9/23/2014 09:14:00 AM
This house price index is only for houses with Fannie or Freddie mortgages. Note: There is also a quarterly expanded index that was up 5.8% year-over-year in Q2.
From the FHFA: FHFA House Price Index Rises in July
U.S. house prices rose in July, up 0.1 percent on a seasonally adjusted basis from the previous month, according to the Federal Housing Finance Agency (FHFA) monthly House Price Index (HPI). The previously reported 0.4 percent increase in June was revised to reflect a 0.3 percent increase.
The FHFA HPI is calculated using home sales price information from mortgages either sold to or guaranteed by Fannie Mae and Freddie Mac. From July 2013 to July 2014, house prices were up 4.4 percent. The U.S. index is 6.4 percent below its April 2007 peak and is roughly the same as the July 2005 index level. This is the eighth consecutive monthly house price increase.
For the nine census divisions, seasonally adjusted monthly price changes from June 2014 to July 2014 ranged from -0.5 percent in the Middle Atlantic division to +0.4 percent in the East North Central division. The 12-month changes were all positive ranging from +1.6 percent in the Middle Atlantic division to +7.2 percent in the Pacific division.
emphasis added
Monday, September 22, 2014
Mortgage News Daily: Mortgage Rates at 4.22%, Down from 4.45% Last September
by Calculated Risk on 9/22/2014 08:41:00 PM
I use the weekly Freddie Mac Primary Mortgage Market Survey® (PMMS®) to track mortgage rates. The PMMS series started in 1971, so there is a fairly long historical series.
For daily rates, the Mortgage News Daily has a series that tracks the PMMS very well, and is usually updated daily around 3 PM ET. The MND data is based on actual lender rate sheets, and is mostly "the average no-point, no-origination rate for top-tier borrowers with flawless scenarios". (this tracks the Freddie Mac series).
MND reports that average 30 Year fixed mortgage rates decreased today to 4.22% from 4.24% on Friday.
One year ago, on Sept 22, 2013, rates were at 4.45%. In 2013, mortgage rates increased rapidly in June, and that led to slower existing home sales later in the year. Sales were still high in July and August - following the rate increase - because borrowers had locked in mortgage rates.
This year, rates have been mostly moving sideways over the last few months - so sales probably won't be negatively impacted by mortgage rates like last year - and existing home sales will probably be up a little year-over-year later this year.
Here is a table from Mortgage News Daily:


