by Calculated Risk on 10/16/2014 05:21:00 PM
Thursday, October 16, 2014
CoStar: Commercial Real Estate prices increased in August
Here is a price index for commercial real estate that I follow.
From CoStar: Commercial Property Prices Sustain Upward Climb in August
Fueled by better than expected job growth, demand continues to outstrip supply across major property types, resulting in tighter vacancy rates and continued investor interest in commercial real estate. The two broadest measures of aggregate pricing for commercial properties within the CCRSI—the value-weighted U.S. Composite Index and the equal-weighted U.S. Composite Index—increased by 1% and 1.5%, respectively, in August 2014.
...
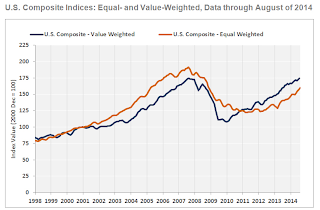
The value-weighted U.S. Composite Index, which is heavily influenced by larger, core transactions, has now reached prerecession peak levels, and price gains have naturally slowed as a result. The Index increased 8.7% for the 12 months ending in August 2014, following 12% growth in the prior 12 months. Meanwhile, price growth in the equal-weighted U.S. Composite Index, which is influenced more by smaller non-core deals, accelerated to an annual rate of 13.6% in August 2014, up from an average of 8.7% in the prior 12 months.
...
Just 10.5% of all repeat sale transactions involved distressed assets in the first eight months of 2014, down from one-third of all repeat sale transactions in 2010.
emphasis added
 Click on graph for larger image.
This graph from CoStar shows the the value-weighted U.S. Composite Index and the equal-weighted U.S. Composite Index indexes.
The value weighted index is back to the pre-recession peak, but the equal weighted is still well below the pre-recession peak.
 The second graph shows the percent of distressed "pairs".
The distressed share is down from over 35% at the peak.
Note: These are repeat sales indexes - like Case-Shiller for residential - but this is based on far fewer pairs.
Earlier: Philly Fed Manufacturing Survey declines to 20.7 in October
by Calculated Risk on 10/16/2014 12:56:00 PM
Earlier from the Philly Fed: October Manufacturing Survey
The diffusion index for current activity edged down from a reading of 22.5 to 20.7 this month ... The current shipments and employment indexes also declined but remained positive, while the current new orders index increased 2 points [to 17.3].This at the consensus forecast of a reading of 20.0 for October.
...
Although positive for the 16th consecutive month, the employment index decreased 9 points. [to 12.1] ...
The survey’s indicators for future manufacturing conditions fell from higher readings but continued to reflect general optimism about growth in activity and employment over the next six months.
emphasis added
 Click on graph for larger image.
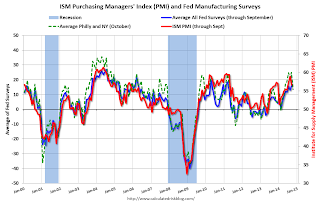
Here is a graph comparing the regional Fed surveys and the ISM manufacturing index. The dashed green line is an average of the NY Fed (Empire State) and Philly Fed surveys through October. The ISM and total Fed surveys are through September.
The average of the Empire State and Philly Fed surveys declined in October, but still suggests another decent ISM report for October.
NAHB: Builder Confidence decreased to 54 in October
by Calculated Risk on 10/16/2014 10:00:00 AM
The National Association of Home Builders (NAHB) reported the housing market index (HMI) was at 54 in October, down from 59 in September. Any number above 50 indicates that more builders view sales conditions as good than poor.
From the NAHB: Four-Month Upturn Ends as Builder Confidence Falls in October
After four consecutive monthly gains, builder confidence in the market for newly built single-family homes fell five points to a level of 54 on the National Association of Home Builders/Wells Fargo Housing Market Index (HMI), released today.
“We are seeing a return to the mid-50s index level trend established earlier in the summer, which is in line with the gradual pace of the housing recovery,” said NAHB Chairman Kevin Kelly, a home builder and developer from Wilmington, Del.
“While there was a dip this month, builders are still positive about the housing market.” “After the HMI posted a nine-year high in September, it’s not surprising to see the number drop in October,” said NAHB Chief Economist David Crowe. “However, historically low mortgage interest rates, steady job gains, and significant pent up demand all point to continued growth of the housing market.”
...
All three HMI components declined in October. The index gauging current sales conditions decreased six points to 57, while the index measuring expectations for future sales slipped three points to 64 and the index gauging traffic of prospective buyers dropped six points to 41.
Looking at the three-month moving averages for regional HMI scores, the Northeast and Midwest remained flat at 41 and 59, respectively. The South rose two points to 58 and the West registered a one-point loss to 57.
emphasis added
 Click on graph for larger image.
This graph show the NAHB index since Jan 1985.
This was below the consensus forecast of 59.
Fed: Industrial Production increased 1.0% in September
by Calculated Risk on 10/16/2014 09:15:00 AM
From the Fed: Industrial production and Capacity Utilization
Industrial production increased 1.0 percent in September and advanced at an annual rate of 3.2 percent in the third quarter of 2014, roughly its average quarterly increase since the end of 2010. In September, manufacturing output moved up 0.5 percent, while the indexes for mining and for utilities climbed 1.8 percent and 3.9 percent, respectively. For the third quarter as a whole, manufacturing production rose at an annual rate of 3.5 percent and mining output increased at an annual rate of 8.7 percent. The output of utilities fell at an annual rate of 8.5 percent for a second consecutive quarterly decline. At 105.1 percent of its 2007 average, total industrial production in September was 4.3 percent above its level of a year earlier. The capacity utilization rate for total industry moved up 0.6 percentage point in September to 79.3 percent, a rate that is 1.0 percentage point above its level of 12 months earlier but 0.8 percentage point below its long-run (1972–2013) average.
emphasis added
 Click on graph for larger image.
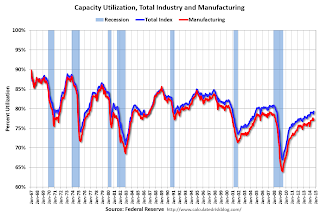
This graph shows Capacity Utilization. This series is up 12.4 percentage points from the record low set in June 2009 (the series starts in 1967).
Capacity utilization at 79.3% is 0.8 percentage points below its average from 1972 to 2012 and below the pre-recession level of 80.8% in December 2007.
Note: y-axis doesn't start at zero to better show the change.
 The second graph shows industrial production since 1967.
Industrial production increased 1.0% in September to 105.1. This is 25.5% above the recession low, and 4.3% above the pre-recession peak.
The monthly change for Industrial Production was above expectations.
Weekly Initial Unemployment Claims decrease to 264,000, 4-Week Average lowest since 2000
by Calculated Risk on 10/16/2014 08:30:00 AM
The DOL reports:
In the week ending October 11, the advance figure for seasonally adjusted initial claims was 264,000, a decrease of 23,000 from the previous week's unrevised level of 287,000. This is the lowest level for initial claims since April 15, 2000 when it was 259,000. The 4-week moving average was 283,500, a decrease of 4,250 from the previous week's unrevised average of 287,750. This is the lowest level for this average since June 10, 2000 when it was 283,500.The previous week was unrevised at 287,000.
There were no special factors impacting this week's initial claims.
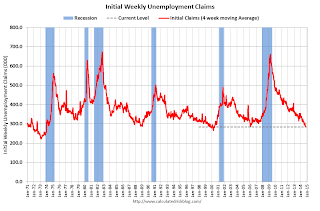
The following graph shows the 4-week moving average of weekly claims since January 1971.
 Click on graph for larger image.
The dashed line on the graph is the current 4-week average. The four-week average of weekly unemployment claims decreased to 283,500.
This was below the consensus forecast of 290,000 and suggests few layoffs.
Wednesday, October 15, 2014
Thursday: Industrial Production, Unemployment Claims, Homebuilder Survey, Philly Fed Mfg Survey
by Calculated Risk on 10/15/2014 07:27:00 PM
Just a highlight of a few prices ...
Brent oil futures are down to $83.78 per barrel, down from $110 a year ago.
National gasoline prices are down to $3.18 per gallon and under $3.00 in many states. This is down from $3.35 per gallon a year ago. If oil prices stay at this level, national gasoline prices will probably fall under $3.00.
30 year fixed mortgage rates are down to 3.90% down from 4.38% a year ago. Loan officer Logan Mohtashami notes:
Right now, people who bought their homes in late 2013 and early 2014 may be good candidates to refinance their mortgages. Having said that, refinance activity is down 72% from the peak in May of 2013 because many already have lower rates and this recent move down won’t mean much to them. Therefore, people who can take advantage of these lower rates will only be a small pool of home owners. For those with the sufficient equity to eliminate their private mortgage insurance due to recent home prices gains, could benefit by refinancing. Others may benefit by combining their first and second loans into one at a new loan as well.As I noted earlier, we will not see a significant increase in refinance activity at these rates, because so many people refinanced in 2012 and early 2013 at even lower rates. Still - for some people as Logan notes - refinancing now makes sense.
Thursday:
• At 8:30 AM, the initial weekly unemployment claims report will be released. The consensus is for claims to increase to 290 thousand from 287 thousand.
• At 9:15 AM, the Fed will release Industrial Production and Capacity Utilization for September. The consensus is for a 0.4% increase in Industrial Production, and for Capacity Utilization to increase to 79.0%.
• At 10:00 AM, the October NAHB homebuilder survey. The consensus is for a reading of 59, unchanged from 59 in September. Any number above 50 indicates that more builders view sales conditions as good than poor.
• Also at 10:00 AM, the the Philly Fed manufacturing survey for October. The consensus is for a reading of 20.0, down from 22.5 last month (above zero indicates expansion).
Fed's Beige Book: Economic Activity Expanded "modest to moderate" pace
by Calculated Risk on 10/15/2014 02:00:00 PM
Fed's Beige Book "Prepared at the Federal Reserve Bank of Minneapolis and based on information collected before October 6, 2014."
Reports from the twelve Federal Reserve Districts generally described modest to moderate economic growth at a pace similar to that noted in the previous Beige Book. Moderate growth was reported by the Cleveland, Chicago, St. Louis, Minneapolis, Dallas, and San Francisco Districts, while modest growth was reported by the New York, Philadelphia, Richmond, Atlanta, and Kansas City Districts. In the Boston District, reports from business contacts painted a mixed picture of economic conditions. In addition, several Districts noted that contacts were generally optimistic about future activity.And on real estate:
Reports on residential construction and real estate activity were mixed. New York noted that single-family construction was sluggish in some areas, but that multifamily construction increased. Philadelphia reported only slight growth in home construction. In August, single-family construction starts in the Cleveland District reached their highest level so far this year, though the number of starts year-to-date remained slightly lower than last year. Richmond noted that residential construction across the District increased slightly for custom homes. Atlanta reported that multifamily construction continued to increase across much of the District, while Chicago indicated that both single- and multi-family construction continued to expand. Residential real estate contacts in the Atlanta District indicated that existing home sales and prices remained ahead of last year's levels and inventory levels were down from a year ago. Chicago noted that home sales were somewhat lower, and growth in home prices and residential rents slowed. San Francisco reported that sales of single-family homes were stable since the previous report.Residential real estate is "mixed', although nonresidential is seeing some growth.
Commercial construction and real estate activity grew in most Districts. Richmond, St. Louis, and San Francisco reported increased commercial construction, industrial construction, or both. Cleveland noted that a majority of commercial contractors saw increased construction activity relative to a year ago. Commercial contractors in the Atlanta District saw an increase in construction activity across many property types. In Minneapolis, however, commercial construction activity declined. Richmond reported that commercial real estate activity improved modestly over the past several weeks. The New York District noted that the New York City office market continued to strengthen. Atlanta noted that many commercial brokers saw growth in activity. Chicago noted that commercial real estate activity continued to expand. Kansas City indicated that commercial vacancy rates declined and absorption and sales increased. Boston noted that commercial real estate fundamentals are either holding steady or improving.
emphasis added
NY Fed: Empire State Manufacturing Survey indicates "business activity grew modestly" in October
by Calculated Risk on 10/15/2014 10:33:00 AM
Earlier from the NY Fed: Empire State Manufacturing Survey
The October 2014 Empire State Manufacturing Survey indicates that business activity grew modestly for New York manufacturers. The headline general business conditions index fell twenty-one points to 6.2, signaling that the pace of growth slowed significantly from last month. The new orders index dropped nineteen points to -1.7, indicating a slight decline in orders, and the shipments index fell twenty-six points to 1.1, indicating that shipments were flat. The employment index rose seven points to 10.2, pointing to an increase in employment levels, while the average workweek index fell to a level just below zero, suggesting that hours worked held steady ...This is the first of the regional surveys for October. The general business conditions index was well below the consensus forecast of a reading of 20.0, and indicates significantly slower expansion (above zero suggests expansion).
Most of the indexes assessing the future outlook were down from last month. Nevertheless, they remained fairly high by historical standards, and conveyed an expectation that activity would continue to grow in the months ahead. The index for future general business conditions fell five points to 41.7.
emphasis added
Retail Sales decreased 0.3% in September
by Calculated Risk on 10/15/2014 08:59:00 AM
On a monthly basis, retail sales decreased 0.3% from August to September (seasonally adjusted), and sales were up 4.3% from September 2013. Sales in August were unrevised at a 0.6% increase.
From the Census Bureau report:
The U.S. Census Bureau announced today that advance estimates of U.S. retail and food services sales for September, adjusted for seasonal variation and holiday and trading-day differences, but not for price changes, were $442.7 billion, a decrease of 0.3 percent from the previous month, but 4.3 percent (±0.9%) above September 2013. ... The July to August 2014 percent change was unrevised from 0.6% (±0.2%).
 Click on graph for larger image.
This graph shows retail sales since 1992. This is monthly retail sales and food service, seasonally adjusted (total and ex-gasoline).
Retail sales ex-autos were down 0.2%.
The second graph shows the year-over-year change in retail sales and food service (ex-gasoline) since 1993.
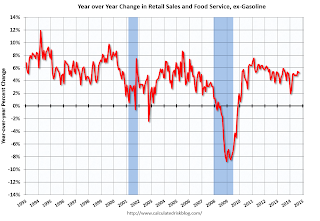 Retail sales ex-gasoline increased by 5.2% on a YoY basis (4.3% for all retail sales).
The decrease in September was above consensus expectations of a 0.1% decrease.
This was a weak report.
MBA: Mortgage Applications Increase in Latest MBA Weekly Survey
by Calculated Risk on 10/15/2014 07:01:00 AM
From the MBA: Mortgage Applications Increase in Latest MBA Weekly Survey
Mortgage applications increased 5.6 percent from one week earlier, according to data from the Mortgage Bankers Association’s (MBA) Weekly Mortgage Applications Survey for the week ending October 10, 2014. ...Note: This mortgage rate is for the week ending Oct 10th; rates have fallen this week.
The Refinance Index increased 11 percent from the previous week. The seasonally adjusted Purchase Index decreased 1 percent from one week earlier. The unadjusted Purchase Index decreased 0.3 percent compared with the previous week and was 4 percent lower than the same week one year ago. ...
...
“Growing concerns about weak economic growth in Europe caused a flight to quality into US assets last week, leading to sharp drops in interest rates. Mortgage rates for most loan products fell to their lowest level since June 2013,” said Mike Fratantoni, MBA’s Chief Economist. “Refinance application volume reached the highest level since June 2014 as a result, with conventional refinance volume at its highest since February 2014.”
...
The average contract interest rate for 30-year fixed-rate mortgages with conforming loan balances ($417,000 or less) decreased to 4.20 percent, the lowest since June 2013, from 4.30 percent, with points decreasing to 0.17 from 0.19 (including the origination fee) for 80 percent loan-to-value ratio (LTV) loans.
emphasis added
 Click on graph for larger image.
The first graph shows the refinance index.
The refinance index is down 72% from the levels in May 2013.
Refinance activity is very low this year and 2014 will be the lowest since year 2000.
 The second graph shows the MBA mortgage purchase index.
 According to the MBA, the unadjusted purchase index is down about 4% from a year ago.


