by Calculated Risk on 12/16/2015 08:40:00 AM
Wednesday, December 16, 2015
Housing Starts increased to 1.173 Million Annual Rate in November
From the Census Bureau: Permits, Starts and Completions
Housing Starts:
Privately-owned housing starts in November were at a seasonally adjusted annual rate of 1,173,000. This is 10.5 percent above the revised October estimate of 1,062,000 and is 16.5 percent above the November 2014 rate of 1,007,000.
Single-family housing starts in November were at a rate of 768,000; this is 7.6 percent above the revised October figure of 714,000. The November rate for units in buildings with five units or more was 398,000.
Building Permits:
Privately-owned housing units authorized by building permits in November were at a seasonally adjusted annual rate of 1,289,000. This is 11.0 percent above the revised October rate of 1,161,000 and is 19.5 percent above the November 2014 estimate of 1,079,000.
Single-family authorizations in November were at a rate of 723,000; this is 1.1 percent above the revised October figure of 715,000. Authorizations of units in buildings with five units or more were at a rate of 539,000 in November.
emphasis added
 Click on graph for larger image.
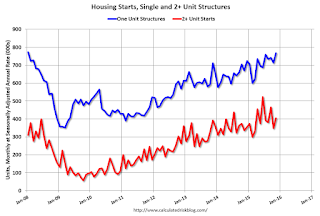
The first graph shows single and multi-family housing starts for the last several years.
Multi-family starts (red, 2+ units) increased in November. Multi-family starts are up 20% year-over-year.
Single-family starts (blue) increased in November and are up 15% year-over-year.
This is the highest level of single family starts since January 2008.
 The second graph shows total and single unit starts since 1968.
 The second graph shows the huge collapse following the housing bubble, and then - after moving sideways for a couple of years - housing is now recovering (but still historically low),
Total housing starts in November were above expectations, and starts for September and October were revised up slightly. A solid report. I'll have more later ...
MBA: Mortgage Applications Decrease in Latest MBA Weekly Survey, Purchase Applications up 34% YoY
by Calculated Risk on 12/16/2015 07:02:00 AM
From the MBA: Mortgage Applications Decrease in Latest MBA Weekly Survey
Mortgage applications decreased 1.1 percent from one week earlier, according to data from the Mortgage Bankers Association’s (MBA) Weekly Mortgage Applications Survey for the week ending December 11, 2015.
...
The Refinance Index increased 1 percent from the previous week. The seasonally adjusted Purchase Index decreased 3 percent from one week earlier. The unadjusted Purchase Index decreased 7 percent compared with the previous week and was 34 percent higher than the same week one year ago.
The average contract interest rate for 30-year fixed-rate mortgages with conforming loan balances ($417,000 or less) remained unchanged at 4.14 percent, with points increasing to 0.45 from 0.43 (including the origination fee) for 80 percent loan-to-value ratio (LTV) loans.
emphasis added
 Click on graph for larger image.
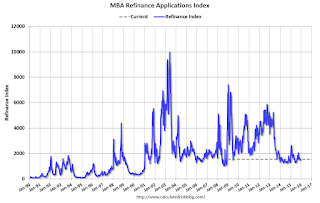
The first graph shows the refinance index.
Refinance activity remains low.
2014 was the lowest year for refinance activity since year 2000, and refinance activity will probably stay low in 2016.
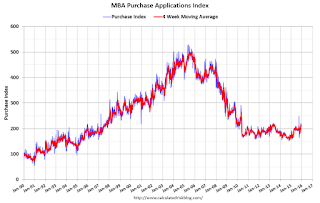
 The second graph shows the MBA mortgage purchase index.
 According to the MBA, the unadjusted purchase index is 34% higher than a year ago.
Tuesday, December 15, 2015
Wednesday: FOMC Announcement, Housing Starts, Industrial Production
by Calculated Risk on 12/15/2015 07:52:00 PM
From the WSJ on the Nuts and Bolts:
The Fed has signaled that the details will be announced in an “implementation note” alongside the usual policy statement, and officials will watch closely to make sure those tools work as expected. “If adjustments to policy tools or administered rates subsequently proved necessary to implement an unchanged policy stance, the implementation note could be revised without altering the [Fed's] policy statement,” according to the central bank’s June meeting minutes.Wednesday:
• At 7:00 AM ET, the Mortgage Bankers Association (MBA) will release the results for the mortgage purchase applications index.
• At 8:30 AM ET, Housing Starts for November. Total housing starts decreased to 1.060 million (SAAR) in October. Single family starts decreased to 722 thousand SAAR in October. The consensus for 1.140 million, up from October.
• At 9:15 AM, the Fed will release Industrial Production and Capacity Utilization for November. The consensus is for a 0.2% decrease in Industrial Production, and for Capacity Utilization to decrease to 77.4%.
• During the day, the AIA's Architecture Billings Index for November (a leading indicator for commercial real estate).
• At 2:00 PM, the FOMC Meeting Announcement. The FOMC is expected to raise the Fed Funds rate at this meeting.
• Also at 2:00 PM, the FOMC Forecasts. This will include the Federal Open Market Committee (FOMC) participants' projections of the appropriate target federal funds rate along with the quarterly economic projections.
• At 2:30 PM, Fed Chair Janet Yellen holds a press briefing following the FOMC announcement.
Lawler: Early Read on Existing Home Sales in November: Big Drop
by Calculated Risk on 12/15/2015 03:48:00 PM
From housing economist Tom Lawler:
Based on publicly-available local realtor/MLS reports released across the country through today, I project that existing home sales as estimated by the National Association of Realtors ran at a seasonally adjusted annual rate of 4.97 million in November, down 7.3% from October’s preliminary estimate and up just 0.4% from last November’s seasonally adjusted pace. Compared to last November unadjusted sales were either flat or down in quite a few (though by no means all) markets across the country, which seems surprising since last November’s sales face fell well below expectations. Overall I estimate that unadjusted existing home sales last month were up by about 2.4% from last November’s pace. (There was one more business day this November compared to last November, so the YOY % change in seasonally adjusted sales should be lower than that for unadjusted sales).
It was not directly clear what led to the sharp slide in seasonally adjusted national home sales last month. Some realtor groups suggested that the October implementation of the new “TRID” rule in early October may have delayed home closings last month, though others suggested that probably this factor wasn’t a “big deal.” And while in a few markets – notably Houston and a few others with exposure to the oil industry – sharp declines in home sales reflected a weakening housing market – that wasn’t apparent in most markets.
It is slightly interesting to note that the monthly % change in existing home sales for each of the last four November’s has been unusually large, as shown in the table below.
| Monthly % Change in Existing Home Sales (SAAR) | ||||
|---|---|---|---|---|
| Nov. 2012 | Nov. 2013 | Nov. 2014 | Nov. 2015** | |
| Preliminary | 5.9% | -4.3% | -6.1% | -7.3% |
| First Revision | 4.8% | -5.9% | -6.3% | |
| Latest* | 3.5% | -4.0% | -4.1% | |
| *includes seasonal factor revisions, done once a year **LEHC estimate | ||||
On the inventory front, my “best guess” is that the NAR’s estimate of the inventory of existing homes for sale at the end of November will be 1.99 million, down 7.0% from October and down 4.3% from a year earlier. In many markets inventories are down much more sharply from a year earlier, though Houston – with listings up by more than 20% from a year ago – is a big exception.
Finally, local realtor/MLS data suggests that the national US median existing SF home sales price last month was up by about 5.9% from last November.
Earlier: NY Fed: Manufacturing Contracts Again in Region, Outlook Improves
by Calculated Risk on 12/15/2015 03:08:00 PM
The NY Fed manufacturing survey indicated contraction for the fifth consecutive month in the New York region. However the outlook has improved.
From the NY Fed: Empire State Manufacturing Survey
The December 2015 Empire State Manufacturing Survey indicates that business activity declined for a fifth consecutive month for New York manufacturers. However, the pace of decline slowed somewhat: the headline general business conditions index, though still negative, moved up six points to -4.6. New orders continued to drop, but shipments increased for the first time since the summer. ...
...
Labor market conditions deteriorated noticeably: the index for number of employees, negative for a fourth consecutive month, fell nine points to -16.2, and the average workweek index plunged thirteen points to -27.3, its lowest level since early 2009.
Indexes for the six-month outlook increased markedly this month, suggesting more widespread optimism about future business conditions. The index for future business conditions jumped eighteen points to 38.5, and the indexes for future new orders and future shipments also rose sharply. Labor market conditions were expected to improve, with the index for expected number of employees little changed at 15.2 and the index for expected workweek rising to 10.1.
emphasis added
Key Measures Show Inflation close to 2% in November
by Calculated Risk on 12/15/2015 11:42:00 AM
The Cleveland Fed released the median CPI and the trimmed-mean CPI this morning:
According to the Federal Reserve Bank of Cleveland, the median Consumer Price Index rose 0.2% (2.1% annualized rate) in November. The 16% trimmed-mean Consumer Price Index rose 0.1% (1.4% annualized rate) during the month. The median CPI and 16% trimmed-mean CPI are measures of core inflation calculated by the Federal Reserve Bank of Cleveland based on data released in the Bureau of Labor Statistics' (BLS) monthly CPI report.Note: The Cleveland Fed has the median CPI details for November here. Motor fuel was down 26% annualized in November.
Earlier today, the BLS reported that the seasonally adjusted CPI for all urban consumers was unchanged (0.3% annualized rate) in November. The CPI less food and energy rose 0.2% (2.2% annualized rate) on a seasonally adjusted basis.
 Click on graph for larger image.
This graph shows the year-over-year change for these four key measures of inflation. On a year-over-year basis, the median CPI rose 2.5%, the trimmed-mean CPI rose 1.9%, and the CPI less food and energy also rose 2.0%. Core PCE is for October and increased 1.3% year-over-year.
On a monthly basis, median CPI was at 2.1% annualized, trimmed-mean CPI was at 1.4% annualized, and core CPI was at 2.2% annualized.
On a year-over-year basis, two of these measures suggest inflation remains below the Fed's target of 2% (core CPI as at 2% and median CPI is above 2%).
Using these measures, inflation has been moving up and is closer to the Fed's target.
NAHB: Builder Confidence declines to 61 in December
by Calculated Risk on 12/15/2015 10:04:00 AM
The National Association of Home Builders (NAHB) reported the housing market index (HMI) was at 61 in December, down from 62 in November. Any number above 50 indicates that more builders view sales conditions as good than poor.
From the NAHB: Builder Confidence Edges Down One Point in December
Builder confidence in the market for newly constructed single-family homes remained relatively flat in December, dropping one point to 61 on the National Association of Home Builders/Wells Fargo Housing Market Index (HMI).
“Overall, builders are optimistic about the housing market, although they are reporting concerns with the high price of lots and labor,” said NAHB Chairman Tom Woods, a home builder from Blue Springs, Mo.
“For the past seven months, builder confidence levels have averaged in the low 60s, which is in line with a gradual, consistent recovery,” said NAHB Chief Economist David Crowe. “With job creation, economic growth and growing household formations, we anticipate the housing market to continue to pick up traction as we head into 2016.”
...
All three HMI components posted modest losses in December. The index measuring sales expectations in the next six months fell two points to 67, the component gauging current sales conditions decreased one point to 66, and the index charting buyer traffic dropped two points to 46.
Looking at the three-month moving averages for regional HMI scores, the West increased three points to 76 while the Northeast rose a single point to 50. Meanwhile the Midwest dropped two points to 58 and the South fell one point to 64.
emphasis added
 Click on graph for larger image.
This graph show the NAHB index since Jan 1985.
This was below the consensus forecast of 63, but still a strong reading.
CoreLogic: "Number of Mortgaged Properties with Negative Equity Down 20.7% Year Over Year"
by Calculated Risk on 12/15/2015 08:58:00 AM
From CoreLogic: CoreLogic Reports 256,000 US Properties Regained Equity in the Third Quarter of 2015
CoreLogic ... today released a new analysis showing 256,000 properties regained equity in the third quarter of 2015, bringing the total number of mortgaged residential properties with equity at the end of Q3 2015 to approximately 46.3 million, or 92.0 percent of all homes with an outstanding mortgage. Nationwide, borrower equity increased year over year by $741 billion in Q3 2015.On states:
The total number of mortgaged residential properties with negative equity stood at 4.1 million, or 8.1 percent, in Q3 2015. That was down 4.7 percent quarter over quarter from 4.3 million homes, or 8.7 percent, compared with Q2 2015 and down 20.7 percent year over year from 5.2 million homes, or 10.4 percent, compared with Q3 2014. ...
For the homes in negative equity status, the national aggregate value of negative equity was $301 billion at the end of Q3 2015, declining approximately $8.1 billion from $309.1 billion in Q2 2015, a decrease of 2.6 percent. On a year-over-year basis, the value of negative equity declined overall from $341 billion in Q3 2014, representing a decrease of 11.8 percent in 12 months.
Of the more than 50 million residential properties with a mortgage, approximately 8.9 million, or 17.6 percent, have less than 20 percent equity (referred to as “under-equitied”) and 1.1 million, or 2.2 percent, have less than 5 percent equity (referred to as near-negative equity). Borrowers who are “under-equitied” may have a difficult time refinancing their existing homes or obtaining new financing to sell and buy another home due to underwriting constraints. Borrowers with near-negative equity are considered at risk of moving into negative equity if home prices fall.
“Home price growth continued to lift borrower equity positions and increase the number of borrowers with sufficient equity to participate in the mortgage market," said Frank Nothaft, chief economist for CoreLogic. "In Q3 2015 there were 37.5 million borrowers with at least 20 percent equity, up 7 percent from 35 million in Q3 2014. In the last three years, borrowers with at least 20 percent equity have increased by 11 million, a substantial uptick that is driving rapid growth in home equity originations.”
emphasis added
"Nevada had the highest percentage of mortgaged residential properties in negative equity at 19.0 percent, followed by Florida (17.8 percent), Arizona (14.6 percent), Rhode Island (12.3 percent) and Maryland (12.1 percent). Combined, these five states account for 29.3 percent of negative equity in the U.S. "Note: The share of negative equity is still very high in Nevada and Florida, but down from a year ago.
 Click on graph for larger image.
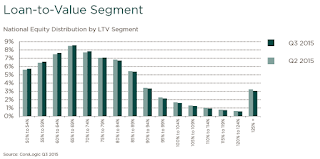
This graph shows the distribution of home equity in Q3 2015 compared to Q2 2015. In Q3, 3.0% of residential properties have 25% or more negative equity, down from 3.2% in Q2 2015.
For reference, three years ago, in Q3 2012, 9.6% of residential properties had 25% or more negative equity.
A year ago, in Q3 2014, there were 5.2 million properties with negative equity - now there are 4.1 million. A significant change.
CPI unchanged in November, Core CPI up 2.0% YoY
by Calculated Risk on 12/15/2015 08:35:00 AM
The Consumer Price Index for All Urban Consumers (CPI-U) was unchanged in November on a seasonally adjusted basis, the U.S. Bureau of Labor Statistics reported today. Over the last 12 months, the all items index increased 0.5 percent before seasonal adjustment.I'll post a graph later today after the Cleveland Fed releases the median and trimmed-mean CPI. This was at the consensus forecast of no change for CPI, and also at the forecast of a 0.2% increase in core CPI.
The indexes for energy and food declined in November, offsetting an increase in the index for all items less food and energy and resulting in the seasonally adjusted all items index being unchanged. The energy index fell 1.3 percent, with all of the major component indexes declining except electricity. ...
The index for all items less food and energy rose 0.2 percent in November, the same increase as in September and October. ... The index for all items less food and energy rose 2.0 percent, its largest 12-month increase since the 12 months ending May 2014.
emphasis added
Monday, December 14, 2015
Tuesday: CPI, NY Fed Mfg, Homebuilder Survey
by Calculated Risk on 12/14/2015 09:25:00 PM
From the WSJ: Junk Bonds Resume Sharp Selloff
The U.S. junk-bond rout deepened Monday, with the bonds of dozens of low-rated companies falling anew and the shares of some large fund-management firms tumbling as well.CR Note: It is called "junk" for a reason! A large portion of the concern is related to debt of energy companies.
The declines reflected gathering concerns about risky companies’ access to financing, traders’ capacity to sell bonds without causing prices to fall, and ripple effects from the closure of a junk-bond mutual fund.
Tuesday:
• At 8:30 AM ET, the Consumer Price Index for November from the BLS. The consensus is for no changed in CPI, and a 0.2% increase in core CPI.
• Also at 8:30 AM, the NY Fed Empire State Manufacturing Survey for December. The consensus is for a reading of -7.0, up from -10.7.
• At 10:00 AM, the December NAHB homebuilder survey. The consensus is for a reading of 63, up from 62 in November. Any number above 50 indicates that more builders view sales conditions as good than poor.


