by Calculated Risk on 2/02/2016 03:30:00 PM
Tuesday, February 02, 2016
U.S. Light Vehicle Sales at 17.46 million annual rate in January
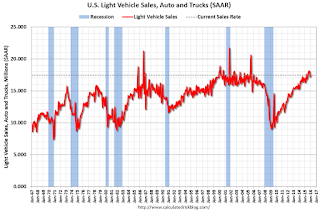
Based on an estimate from WardsAuto, light vehicle sales were at a 17.46 million SAAR in January.
That is up about 5% from January 2015, and up about 1.4% from the 17.2 million annual sales rate last month.
Click on graph for larger image.
This graph shows the historical light vehicle sales from the BEA (blue) and an estimate for December (red, light vehicle sales of 17.46 million SAAR from WardsAuto).
This close to the consensus forecast of 17.5 million SAAR (seasonally adjusted annual rate).
The second graph shows light vehicle sales since the BEA started keeping data in 1967.

This was at expectations, and vehicle sales in 2016 are off to a solid start.
The Return of Alt-A?
by Calculated Risk on 2/02/2016 12:03:00 PM
Kirsten Grind writes at the WSJ: Crisis-Era Mortgage Attempts a Comeback
These mortgages, which are given to borrowers that can’t fully document their income, helped fuel a tidal wave of defaults during the housing crisis and subsequently fell out of favor.Tanta explained Alt-A (and foresaw the name change): Reflections on Alt-A
Now, big money managers including Neuberger Berman, Pacific Investment Management Co. and an affiliate of Blackstone Group LP are lobbying lenders to make more of these “Alt-A” loans ...
...
There has also been a rebranding effort: Most lenders prefer to call these products “nonqualified mortgages” due to the stigma attached to the Alt-A category.
Eventually, after the bust works itself out and the economy leaves recession and the bankers crawl out from under their desks and stretch out those limbs that have been cramped into the fetal position, a kind of "not quite quite" lending will certainly return. I am in no way suggesting that the mortgage business has entered the Straight and Narrow Path and is going to stay on it forever because we have Learned Our Lessons. Credit cycles--not to mention institutional memories and economies like ours--don't work that way. It's just that whatever loosened lending re-emerges après le deluge will not be called "Alt-A."If you read closely, what Grind is describing isn't the bubble type "Alt-A" mortgages, rather it is collateral based lending - a version of subprime.
...
Alt-A is sort of a weird mirror-image of subprime lending. If subprime was traditionally about borrowers with good capacity and collateral but bad credit history, Alt-A was about borrowers with a good credit history but pretty iffy capacity and collateral. That is to say, while subprime makes some amount of sense, Alt-A never made any sense. It is a child of the bubble.
If bubble type "Alt-A" tries to make a return, then the regulators should just say No!
CoreLogic: House Prices up 6.3% Year-over-year in December
by Calculated Risk on 2/02/2016 09:11:00 AM
Notes: This CoreLogic House Price Index report is for December. The recent Case-Shiller index release was for November. The CoreLogic HPI is a three month weighted average and is not seasonally adjusted (NSA).
From CoreLogic: CoreLogic US Home Price Report Shows Home Prices Up 6.3 Percent Year Over Year in December 2015
Home prices nationwide, including distressed sales, increased year over year by 6.3 percent in December 2015 compared with December 2014 and increased month over month by 0.8 percent in December 2015 compared with November 2015, according to the CoreLogic HPI.
...
“Nationally, home prices have been rising at a 5 to 6 percent annual rate for more than a year,” said Dr. Frank Nothaft, chief economist for CoreLogic. “However, local-market growth can vary substantially from that. Some metropolitan areas have had double-digit appreciation, such as Denver and Naples, Florida, while others have had price declines, like New Orleans and Rochester, New York.”
emphasis added
 Click on graph for larger image.
 This graph shows the national CoreLogic HPI data since 1976. January 2000 = 100.
The index was up 0.8% in December (NSA), and is up 6.3% over the last year.
This index is not seasonally adjusted, and this was a solid month-to-month increase.
The second graph shows the YoY change in nominal terms (not adjusted for inflation).
 The YoY increase had been moving sideways over the last year, but has picked up a recently.
The year-over-year comparison has been positive for forty six consecutive months.
Monday, February 01, 2016
Fannie Mae: Mortgage Serious Delinquency rate declined in December
by Calculated Risk on 2/01/2016 06:40:00 PM
Tuesday:
• All day: Light vehicle sales for January. The consensus is for light vehicle sales to increase to 17.5 million SAAR in January from 17.2 million in December (Seasonally Adjusted Annual Rate).
Fannie Mae reported today that the Single-Family Serious Delinquency rate declined in December to 1.55% from 1.58% in November. The serious delinquency rate is down from 1.89% in December 2014, and this is the lowest level since August 2008.
The Fannie Mae serious delinquency rate peaked in February 2010 at 5.59%.
Note: These are mortgage loans that are "three monthly payments or more past due or in foreclosure".
Note: Freddie Mac reported last week that their Single-Family serious delinquency rate declined in December to 1.32%, down from 1.36% in November.

The Fannie Mae serious delinquency rate has only fallen 0.34 percentage points over the last year - the pace of improvement has slowed - and at that pace the serious delinquency rate will not be below 1% until 2017.
The "normal" serious delinquency rate is under 1%, so maybe Fannie Mae serious delinquencies will be close to normal some time in 2017. This elevated delinquency rate is mostly related to older loans - the lenders are still working through the backlog.
Black Knight December Mortgage Monitor
by Calculated Risk on 2/01/2016 02:45:00 PM
Black Knight Financial Services (BKFS) released their Mortgage Monitor report for December today. According to BKFS, 4.78% of mortgages were delinquent in December, down from 4.92% in November. BKFS reported that 1.37% of mortgages were in the foreclosure process.
This gives a total of 6.15% delinquent or in foreclosure.
Press Release: Black Knight's December 2015 Mortgage Monitor: Home Affordability Still Better than Pre-Bubble Average; $64B in Equity Tapped Via Cash-Out Refis During Past 12 Months
Today, the Data & Analytics division of Black Knight Financial Services, Inc. (NYSE: BKFS) released its latest Mortgage Monitor Report, based on data as of the end of December 2015. ...
...
"We also returned to the subject of cash-out refinances. Nearly 300,000 were originated in Q3 2015 and roughly 1 million over the past 12 months, marking six consecutive quarters of rising cash-out refi volumes. In Q3 2015, 42 percent of all first lien refinances involved a cash-out component, the highest share since 2008. Likewise, the average cash-out amount – over $60,000 – is the highest since 2007. All totaled, there was $64 billion in equity tapped via cash-out refinances over the past 12 months, the highest dollar amount for any equivalent 12-month period since 2008-2009. Even so, this amounted to less than 2 percent of available equity being tapped. This is slightly below the post-crisis norm, and 80 percent less than the total amount of equity extracted from the market in 2005-2006. The resulting LTV and credit score risk of recent cash-out refinances remains low as well – average credit scores on cash-out refinances are 748, and the resulting post-cash-out average LTV of 67 percent is the lowest level on record."
Finally, Black Knight looked at the full year of foreclosure activity in review and found that overall foreclosure starts were down 12 percent from 2014. First-time foreclosure starts -- driven lower by the more pristine performance of recent vintages and reduced inflow of severely delinquent loans from crisis era vintages -- were down 19 percent from last year, marking their lowest volume in over a decade. In fact, there were 30 percent fewer first-time foreclosure starts in 2015 than in 2005 during the run up to the housing crisis. The 377,000 foreclosure sales (completions) over the course of the year represented a 17 percent decline from 2014, and a 70 percent drop from the peak of sale activity in 2010. All totaled, there have now been 7.1 million residential homes lost to foreclosure sale since the beginning of 2007. Active foreclosure inventory ended the year below 700,000 for the first time since 2006, less than a third of what it was at the height of the crisis.
emphasis added
 Click on graph for larger image.
This graph from Black Knight shows foreclosure starts since 2005.
From Black Knight:
Foreclosure starts were down 12 percent in 2015; first time starts fell 19 percent, while repeat foreclosures – loans that had been referred to foreclosure at least once in the past – were only down 4 percent
Driven lower by pristine performance of recent vintages and reduced inflow of severely delinquent loans from crisis era vintages, first time foreclosure starts fell to their lowest level in over a decade
In fact, there were 30 percent fewer first time starts in 2015 than in 2005 during the run up to the housing crisis
 From Black Knight:
 Nearly 300,000 cashout refinances were originated in Q3 2015 – a 39 percent increase over 2014 – and approximately 1 million were originated over the past 12 monthsThis is still a small number of cash out refinances compared to the bubble years. There is much more in the mortgage monitor.
Construction Spending increased 0.1% in December, Up 10.5% in 2015 vs 2014
by Calculated Risk on 2/01/2016 11:55:00 AM
The Census Bureau reported that overall construction spending increased slightly in December compared to November:
The U.S. Census Bureau of the Department of Commerce announced today that construction spending during December 2015 was estimated at a seasonally adjusted annual rate of $1,116.6 billion, 0.1 percent above the revised November estimate of $1,116.0 billion. The December figure is 8.2 percent above the December 2014 estimate of $1,031.6 billion.Private spending decreased and public spending increased in December:
The value of construction in 2015 was $1,097.3 billion, 10.5 percent above the $993.4 billion spent in 2014.
Spending on private construction was at a seasonally adjusted annual rate of $824.0 billion, 0.6 percent below the revised November estimate of $828.8 billion. ...
In December, the estimated seasonally adjusted annual rate of public construction spending was $292.5 billion, 1.9 percent above the revised November estimate of $287.1 billion.
emphasis added
 Click on graph for larger image.
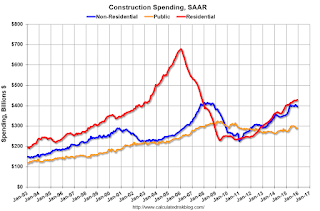
This graph shows private residential and nonresidential construction spending, and public spending, since 1993. Note: nominal dollars, not inflation adjusted.
Private residential spending has been increasing, but is 37% below the bubble peak.
Non-residential spending is only 5% below the peak in January 2008 (nominal dollars).
Public construction spending is now 10% below the peak in March 2009 and about 11% above the post-recession low.
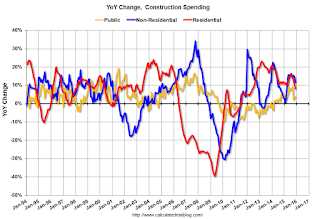
 The second graph shows the year-over-year change in construction spending.
On a year-over-year basis, private residential construction spending is up 8%. Non-residential spending is up 11% year-over-year. Public spending is up 4% year-over-year.
Looking forward, all categories of construction spending should increase in 2016. Residential spending is still very low, non-residential is increasing (except oil and gas), and public spending is also increasing after several years of austerity.
This was below the consensus forecast of a 0.6% increase for December, but overall growth for construction spending in 2015 was solid, up 10.5% from 2014.
ISM Manufacturing index increased to 48.2 in January
by Calculated Risk on 2/01/2016 10:08:00 AM
The ISM manufacturing index indicated contraction in January. The PMI was at 48.2% in January, up from 48.0% in December. The employment index was at 45.9%, down from 48.0% in December, and the new orders index was at 51.5%, up from 48.8%.
From the Institute for Supply Management: January 2016 Manufacturing ISM® Report On Business®
Economic activity in the manufacturing sector contracted in January for the fourth consecutive month, while the overall economy grew for the 80th consecutive month, say the nation’s supply executives in the latest Manufacturing ISM® Report On Business®.
The report was issued today by Bradley J. Holcomb, CPSM, CPSD, chair of the Institute for Supply Management® (ISM®) Manufacturing Business Survey Committee. "The January PMI® registered 48.2 percent, an increase of 0.2 percentage point from the seasonally adjusted December reading of 48 percent. The New Orders Index registered 51.5 percent, an increase of 2.7 percentage points from the seasonally adjusted reading of 48.8 percent in December. The Production Index registered 50.2 percent, 0.3 percentage point higher than the seasonally adjusted December reading of 49.9 percent. The Employment Index registered 45.9 percent, 2.1 percentage points below the seasonally adjusted December reading of 48 percent. Inventories of raw materials registered 43.5 percent, the same reading as in December. The Prices Index registered 33.5 percent, the same reading as in December, indicating lower raw materials prices for the 15th consecutive month. Comments from the panel indicate a mix ranging from strong to soft orders, as eight of our 18 industries report an increase in orders, and seven industries report a decrease in orders."
emphasis added
 Click on graph for larger image.
Here is a long term graph of the ISM manufacturing index.
This was close to expectations of 48.3%, and suggests manufacturing contracted in January.
Personal Income increased 0.3% in December, Spending decreased slightly
by Calculated Risk on 2/01/2016 08:35:00 AM
The BEA released the Personal Income and Outlays report for December:
Personal income increased $42.5 billion, or 0.3 percent, ... according to the Bureau of Economic Analysis.Personal consumption expenditures (PCE) decreased $0.7 billion, or less than 0.1 percent.On inflation: The PCE price index increased 0.6 percent year-over-year due to the sharp decline in oil prices. The core PCE price index (excluding food and energy) increased 1.4 percent year-over-year in December.
...
Real PCE -- PCE adjusted to remove price changes -- increased 0.1 percent in December, compared with an increase of 0.4 percent in November. ... The price index for PCE decreased 0.1 percent in December, in contrast to an increase of 0.1 percent in November. The PCE price index, excluding food and energy, increased less than 0.1 percent, compared to an increase of 0.2 percent.
The December PCE price index increased 0.6 percent from December a year ago. The December PCE price index, excluding food and energy, increased 1.4 percent from December a year ago.
Sunday, January 31, 2016
Monday: Personal Income and Outlays, ISM Mfg Survey, Construction Spending
by Calculated Risk on 1/31/2016 08:12:00 PM
Weekend:
• Schedule for Week of January 31, 2016
• January 2016: Unofficial Problem Bank list declines to 238 Institutions
Monday:
• At 8:30 AM ET, Personal Income and Outlays for December. The consensus is for a 0.3% increase in personal income, and for a 0.1% increase in personal spending. And for the Core PCE price index to increase 0.1%.
• At 10:00 AM, ISM Manufacturing Index for January. The consensus is for the ISM to be at 48.3, up from 48.2 in December.
• Also at 10:00 AM, Construction Spending for December. The consensus is for a 0.6% increase in construction spending.
• At 1:00 PM, Discussion, Fed Vice Chairman Stanley Fischer, Recent Monetary Policy, Council on Foreign Relations Event: C. Peter McColough Series on International Economics, New York, N.Y.
From CNBC: Pre-Market Data and Bloomberg futures: currently S&P futures are down 7 and DOW futures are down 60 (fair value).
Oil prices were up over the last week with WTI futures at $33.29 per barrel and Brent at $35.56 per barrel. A year ago, WTI was at $45, and Brent was at $47 - so prices are down about 30% year-over-year.
Here is a graph from Gasbuddy.com for nationwide gasoline prices. Nationally prices are at $1.79 per gallon (down over $0.20 per gallon from a year ago).
Hotel Occupancy: Solid Start for 2016
by Calculated Risk on 1/31/2016 11:13:00 AM
Here is an update on hotel occupancy from HotelNewsNow.com: STR: US results for week ending 23 January
The U.S. hotel industry reported mixed results in the three key performance measurements during the week of 17-23 January 2016, according to data from STR, Inc.The following graph shows the seasonal pattern for the hotel occupancy rate using the four week average. Hotels are currently in the weakest part of the year; December and January.
In year-over-year measurements, the industry’s occupancy decreased 1.9% to 56.2%. Average daily rate for the week rose 2.5% to US$116.51, and revenue per available room increased 0.5% to US$65.51.
emphasis added
 The red line is for 2016, dashed orange is 2015, blue is the median, and black is for 2009 - the worst year since the Great Depression for hotels.
2015 was the best year on record for hotels.
So far 2016 is tracking close to 2015. A solid start to the year.
Data Source: Smith Travel Research, Courtesy of HotelNewsNow.com


