by Calculated Risk on 3/09/2016 12:13:00 PM
Wednesday, March 09, 2016
Update: Prime Working-Age Population Growing Again
An update: in 2014, I posted some demographic data for the U.S., see: Census Bureau: Largest 5-year Population Cohort is now the "20 to 24" Age Group, Decline in the Labor Force Participation Rate: Mostly Demographics and Long Term Trends, and The Future's so Bright ...
I pointed out that "even without the financial crisis we would have expected some slowdown in growth this decade (just based on demographics). The good news is that will change soon."
Changes in demographics are an important determinant of economic growth, and although most people focus on the aging of the "baby boomer" generation, the movement of younger cohorts into the prime working age is another key story. Here is a graph of the prime working age population (this is population, not the labor force) from 1948 through February 2016.

There was a huge surge in the prime working age population in the '70s, '80s and '90s - and the prime age population has been mostly flat recently (even declined a little).
The prime working age labor force grew even quicker than the population in the '70s and '80s due to the increase in participation of women. In fact, the prime working age labor force was increasing 3%+ per year in the '80s!
So when we compare economic growth to the '70s, '80, or 90's we have to remember this difference in demographics (the '60s saw solid economic growth as near-prime age groups increased sharply).
See: Demographics and GDP: 2% is the new 4%
The prime working age population peaked in 2007, and bottomed at the end of 2012. There are still fewer people in the 25 to 54 age group than in 2007.
The good news is the prime working age group has started to grow again, and is now growing at 0.5% per year - and this should boost economic activity. And it appears the prime working age group will exceed the previous peak later this year.
Demographics are now improving in the U.S.!
Update: U.S. Heavy Truck Sales
by Calculated Risk on 3/09/2016 10:01:00 AM
Update: The WSJ has an article last week: Truck Orders Plummeted 43% in February (ht Dividend Master). Maybe sales will decline in the coming months.
The following graph shows heavy truck sales since 1967 using data from the BEA. The dashed line is the February 2016 seasonally adjusted annual sales rate (SAAR).
Heavy truck sales really collapsed during the recession, falling to a low of 181 thousand in April 2009, on a seasonally adjusted annual rate basis (SAAR). Since then sales increased more than 2 1/2 times, and hit 491 thousand SAAR in November 2015.
Heavy truck sales declined in February to 440 thousand SAAR.
The level in November 2015 was the highest level since December 2006 (9 years ago). Sales have been above 400 thousand SAAR for 20 consecutive months, are now above the average (and median) of the last 20 years.
These are strong sales, especially considering the recent weakness in the oil sector.
Click on graph for larger image.
MBA: Mortgage Applications Increased in Latest Weekly Survey, Purchase Applications up 30% YoY
by Calculated Risk on 3/09/2016 07:00:00 AM
From the MBA: Purchase Apps Up, Refinance Apps Down in Latest MBA Weekly Survey
Mortgage applications increased 0.2 percent from one week earlier, according to data from the Mortgage Bankers Association’s (MBA) Weekly Mortgage Applications Survey for the week ending March 4, 2016.
...
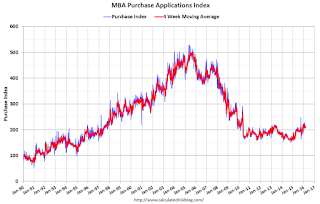
The Refinance Index decreased 2 percent from the previous week. The seasonally adjusted Purchase Index increased 4 percent to the highest level since January 2016. The unadjusted Purchase Index increased 6 percent compared with the previous week and was 30 percent higher than the same week one year ago.
...
he average contract interest rate for 30-year fixed-rate mortgages with conforming loan balances ($417,000 or less) increased to 3.89 percent from 3.83 percent, with points decreasing to 0.38 from 0.39 (including the origination fee) for 80 percent loan-to-value ratio (LTV) loans.
emphasis added
 Click on graph for larger image.
The first graph shows the refinance index since 1990.
Refinance activity was higher in 2015 than in 2014, but it was still the third lowest year since 2000.
Refinance activity has picked up recently as rates have declined.
 The second graph shows the MBA mortgage purchase index.
 According to the MBA, the unadjusted purchase index is 30% higher than a year ago.
Tuesday, March 08, 2016
Hilsenrath: Fed to "Keep Options Open for April or June"
by Calculated Risk on 3/08/2016 03:37:00 PM
Wednesday:
• At 7:00 AM ET, the Mortgage Bankers Association (MBA) will release the results for the mortgage purchase applications index.
It is pretty clear that there will not be a rate hike at the FOMC meeting next week, but the Fed will want to keep the April and June meetings in play.
From Jon Hilsenrath at the WSJ: Fed Likely to Stand Pat on Rates, Keep Options Open for April or June
Federal Reserve officials are likely to hold short-term interest rates steady at their policy meeting next week and leave open-ended when they’ll next raise rates given their uncertainties about markets and global growth.
For Fed Chairwoman Janet Yellen, that likely means crafting a message that gives the central bank flexibility to lift rates in April or June should the economy perform well in the weeks ahead, without committing to a move in case economic data disappoint or new market turmoil erupts.
Demographics: Renting vs. Owning
by Calculated Risk on 3/08/2016 01:15:00 PM
Note; This is an update to a post I wrote last year.
It was six years ago that we started discussing the turnaround for apartments. Then, in January 2011, I attended the NMHC Apartment Strategies Conference in Palm Springs, and the atmosphere was very positive.
The drivers in 2011 were 1) very low new supply, and 2) strong demand (favorable demographics, and people moving from owning to renting).
The move "from owning to renting" is mostly over, and demographics for apartments are still positive - but less favorable than 6 years ago. Also much more supply has come online. Slowing demand and more supply for apartments is why I think growth in multi-family starts will slow this year (or maybe be flat compared to 2015).
On demographics, a large cohort had been moving into the 20 to 29 year old age group (a key age group for renters). Going forward, a large cohort will be moving into the 30 to 39 age group (a key for ownership).
Note: Household formation would be a better measure than population, but reliable data for households is released with a long lag.

This graph shows the longer term trend for three key age groups: 20 to 29, 25 to 34, and 30 to 39 (the groups overlap).
This graph is from 1990 to 2060 (all data from BLS: current to 2060 is projected).
We can see the surge in the 20 to 29 age group (red). Once this group exceeded the peak in earlier periods, there was an increase in apartment construction. This age group will peak in 2018 (until the 2030s), and the 25 to 34 age group (orange, dashed) will peak in 2023. This suggests demand for apartments will soften in a few years.
For buying, the 30 to 39 age group (blue) is important (note: see Demographics and Behavior for some reasons for changing behavior). The population in this age group is increasing, and will increase significantly over the next decade.
This demographics is positive for home buying, and this is a key reason I expect single family housing starts to continue to increase in coming years.
Phoenix Real Estate in February: Sales down 3%, Inventory down slightly
by Calculated Risk on 3/08/2016 10:28:00 AM
This is a key distressed market to follow since Phoenix saw a large bubble / bust followed by strong investor buying.
For the fifteenth consecutive month, inventory was down year-over-year in Phoenix.
The Arizona Regional Multiple Listing Service (ARMLS) reports (table below):
1) Overall sales in February were down 2.6% year-over-year.
2) Cash Sales (frequently investors) were down to 29.0% of total sales.
3) Active inventory is now down 0.7% year-over-year.
More inventory (a theme in 2014) - and less investor buying - suggested price increases would slow sharply in 2014. And prices increases did slow in 2014, only increasing 2.4% according to Case-Shiller.
In 2015, with falling inventory, prices increased a little faster - Prices were up 6.3% in 2015 according to Case-Shiller. Inventory is something to watch in 2016!
| February Residential Sales and Inventory, Greater Phoenix Area, ARMLS | ||||||
|---|---|---|---|---|---|---|
| Sales | YoY Change Sales | Cash Sales | Percent Cash | Active Inventory | YoY Change Inventory | |
| Feb-2008 | 3,445 | --- | 650 | 18.9% | 57,3051 | --- |
| Feb-2009 | 5,477 | 59.0% | 2,188 | 39.9% | 52,013 | -9.2% |
| Feb-2010 | 6,595 | 20.4% | 2,997 | 45.4% | 42,388 | -18.5% |
| Feb-2011 | 7,171 | 8.7% | 3,776 | 52.7% | 40,666 | -4.1% |
| Feb-2012 | 7,249 | 1.1% | 3,616 | 49.9% | 23,736 | -41.6% |
| Feb-2013 | 6,618 | -8.7% | 3,053 | 46.1% | 21,718 | -8.5% |
| Feb-2014 | 5,476 | -17.3% | 1,939 | 35.4% | 29,899 | 37.7% |
| Feb-2015 | 5,970 | 9.0% | 1,784 | 29.9% | 27,382 | -8.4% |
| Feb-2016 | 5,816 | -2.6% | 1,688 | 29.0% | 27,202 | -0.7% |
| 1 February 2008 probably included pending listings | ||||||
NFIB: Small Business Optimism Index decreased in February
by Calculated Risk on 3/08/2016 09:02:00 AM
From the National Federation of Independent Business (NFIB): Small Business Optimism Falls Again This Month
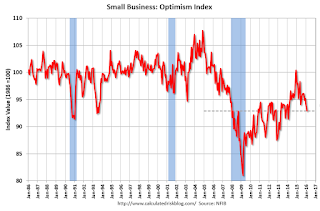
The Index of Small Business Optimism fell 1 point from January, falling to 92.9. None of the 10 Index components posted a gain, six posted small declines, and four were unchanged. ...
Reported job creation reversed in February, with an average employment change per firm falling to a decline in employment of -0.12 workers per firm. ...
emphasis added
 Click on graph for larger image.
This graph shows the small business optimism index since 1986.
The index decreased to 92.9 in February.
Monday, March 07, 2016
Tuesday: Small Business Optimism
by Calculated Risk on 3/07/2016 07:01:00 PM
Tuesday:
• At 9:00 AM ET, NFIB Small Business Optimism Index for February.

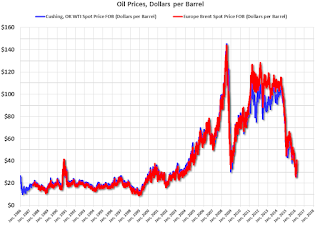
This graph shows WTI and Brent spot oil prices from the EIA. (Prices today added). According to Bloomberg, WTI is at $37.84 per barrel today, and Brent is at $40.84
Prices really collapsed at the end of 2014 - and then rebounded a little - and then collapsed again.
This puts the recent price increase into perspective!
Update: Framing Lumber Prices down about 15% Year-over-year
by Calculated Risk on 3/07/2016 03:24:00 PM
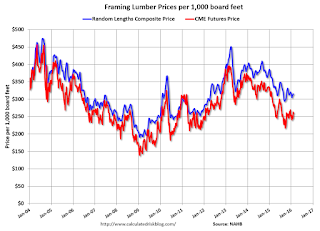
Here is another graph on framing lumber prices. Early in 2013 lumber prices came close to the housing bubble highs.
The price increases in early 2013 were due to a surge in demand (more housing starts) and supply constraints (framing lumber suppliers were working to bring more capacity online).
Prices didn't increase as much early in 2014 (more supply, smaller "surge" in demand).
In 2015, even with the pickup in U.S. housing starts, prices were down year-over-year. Note: Multifamily starts do not use as much lumber as single family starts, and there was a surge in multi-family starts.
Overall the decline in prices is probably due to more supply, and less demand from China.

This graph shows two measures of lumber prices: 1) Framing Lumber from Random Lengths through February 2016 (via NAHB), and 2) CME framing futures.
Right now Random Lengths prices are down about 13% from a year ago, and CME futures are down around 16% year-over-year.
Las Vegas Real Estate in February: Sales Increased 9% YoY, Inventory Up Slightly
by Calculated Risk on 3/07/2016 11:01:00 AM
This is a key distressed market to follow since Las Vegas has seen the largest price decline of any of the Case-Shiller composite 20 cities.
The Greater Las Vegas Association of Realtors reported Local Housing Market in Good Shape Heading into Spring, GLVAR Reports
According to GLVAR, the total number of existing local homes, condominiums and townhomes sold in February was 2,676, up from 2,452 in February of 2015. Compared to the same month one year ago, 7.5 percent more homes and 15.8 percent more condos and townhomes sold in February.1) Overall sales were up 9.1% year-over-year.
...
By the end of February, GLVAR reported 7,328 single-family homes listed without any sort of offer. That’s up a mere 0.2 percent from one year ago. For condos and townhomes, the 2,267 properties listed without offers in February represented a 6.5 percent decrease from one year ago.
GLVAR continued to report annual declines in distressed sales and increasing numbers of traditional home sales, where lenders are not controlling the transaction. In February, 6.6 percent of all local sales were short sales – when lenders allow borrowers to sell a home for less than what they owe on the mortgage. That’s down from 9.3 percent of all sales one year ago. Another 8.6 percent of all February sales were bank-owned, down from 9.7 percent one year ago.
emphasis added
2) The percent of cash sales decreased year-over-year from 37.4% in Feb 2015 to 31.4% in Feb 2016. This has been trending down.
3) Non-contingent inventory for single-family homes was up 0.2% year-over-year. The table below shows the year-over-year change for non-contingent inventory in Las Vegas. Inventory is important to watch - if inventory starts increasing again, then price increases will slow.
| Las Vegas: Year-over-year Change in Non-contingent Single-Family Inventory | |
|---|---|
| Month | YoY |
| Jan-13 | -58.3% |
| Feb-13 | -53.4% |
| Mar-13 | -42.1% |
| Apr-13 | -24.1% |
| May-13 | -13.2% |
| Jun-13 | 3.7% |
| Jul-13 | 9.0% |
| Aug-13 | 41.1% |
| Sep-13 | 60.5% |
| Oct-13 | 73.4% |
| Nov-13 | 77.4% |
| Dec-13 | 78.6% |
| Jan-14 | 96.2% |
| Feb-14 | 107.3% |
| Mar-14 | 127.9% |
| Apr-14 | 103.1% |
| May-14 | 100.6% |
| Jun-14 | 86.2% |
| Jul-14 | 55.2% |
| Aug-14 | 38.8% |
| Sep-14 | 29.5% |
| Oct-14 | 25.6% |
| Nov-14 | 20.0% |
| Dec-14 | 18.0% |
| Jan-15 | 12.9% |
| Feb-15 | 15.8% |
| Mar-15 | 12.2% |
| Apr-15 | 7.6% |
| May-15 | 7.8% |
| Jun-15 | 4.3% |
| Jul-15 | 5.1% |
| Aug-15 | 3.5% |
| Sep-15 | -0.8% |
| Oct-15 | -7.1% |
| Nov-15 | -5.2% |
| Dec-15 | -11.2% |
| Jan-16 | 0.6% |
| Feb-16 | 0.2% |


