by Calculated Risk on 4/01/2016 10:06:00 AM
Friday, April 01, 2016
ISM Manufacturing index increased to 51.8 in March
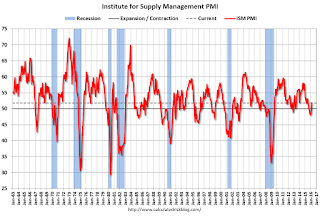
The ISM manufacturing index indicated expansion in March after five months of contraction. The PMI was at 51.8% in March, up from 49.5% in February. The employment index was at 48.1%, down slightly from 48.5% in February, and the new orders index was at 58.3%, up sharply from February.
From the Institute for Supply Management: March 2016 Manufacturing ISM® Report On Business®
Economic activity in the manufacturing sector expanded in March for the first time in the last six months, while the overall economy grew for the 82nd consecutive month, say the nation’s supply executives in the latest Manufacturing ISM® Report On Business®.
The report was issued today by Bradley J. Holcomb, CPSM, CPSD, chair of the Institute for Supply Management® (ISM®) Manufacturing Business Survey Committee. "The March PMI® registered 51.8 percent, an increase of 2.3 percentage points from the February reading of 49.5 percent. The New Orders Index registered 58.3 percent, an increase of 6.8 percentage points from the February reading of 51.5 percent. The Production Index registered 55.3 percent, 2.5 percentage points higher than the February reading of 52.8 percent. The Employment Index registered 48.1 percent, 0.4 percentage point below the February reading of 48.5 percent. Inventories of raw materials registered 47 percent, an increase of 2 percentage points above the February reading of 45 percent. The Prices Index registered 51.5 percent, an increase of 13 percentage points above the February reading of 38.5 percent, indicating higher raw materials prices for the first time since October 2014. Manufacturing registered growth in March for the first time since August 2015, as 12 of our 18 industries reported sector growth, and 13 of our 18 industries reported an increase in new orders in March."
emphasis added
 Click on graph for larger image.
Here is a long term graph of the ISM manufacturing index.
This was above expectations of 50.5%, and suggests manufacturing expanded in March.
Comments: Another Solid Employment Report
by Calculated Risk on 4/01/2016 09:36:00 AM
This was another solid employment report.
Earlier: March Employment Report: 215,000 Jobs, 5.0% Unemployment Rate
A few numbers: Total employment is now 5.3 million above the previous peak. Total employment is up 14.0 million from the employment recession low.
Private payroll employment increased 195,000 in March, and private employment is now 5.6 million above the previous peak. Private employment is up 14.4 million from the recession low.
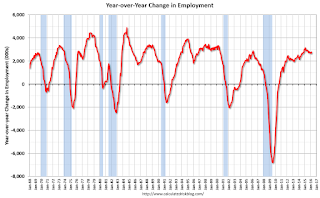
In March, the year-over-year change was 2.80 million jobs.
Employment-Population Ratio, 25 to 54 years old

In the earlier period the participation rate for this group was trending up as women joined the labor force. Since the early '90s, the participation rate moved more sideways, with a downward drift starting around '00 - and with ups and downs related to the business cycle.
The 25 to 54 participation rate increased in March to 81.4%, and the 25 to 54 employment population ratio increased to 78.0%. The participation rate and employment population ratio for this group has increased sharply over the last several months.
The participation rate for this group might increase a little more (or at least stabilize for a couple of years) - although the participation rate has been trending down for this group since the late '90s.
Average Hourly Earnings

On a monthly basis, wages increased at a 3.4% annual rate in March.
The graph shows the nominal year-over-year change in "Average Hourly Earnings" for all private employees. Nominal wage growth was at 2.3% YoY in March. This series is noisy, however overall wage growth is trending up.
Note: CPI has been running under 2%, so there has been real wage growth.
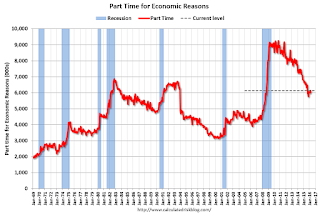
Part Time for Economic Reasons

The number of persons employed part time for economic reasons (also referred to as involuntary part-time workers) was about unchanged in March at 6.1 million and has shown little movement since November. These individuals, who would have preferred full-time employment, were working part-time because their hours had been cut back or because they were unable to find a full-time job.The number of persons working part time for economic reasons increased in March. This level suggests slack still in the labor market.
These workers are included in the alternate measure of labor underutilization (U-6) that increased to 9.8% in March.
Unemployed over 26 Weeks
 This graph shows the number of workers unemployed for 27 weeks or more.
 According to the BLS, there are 2.213 million workers who have been unemployed for more than 26 weeks and still want a job. This was up from 2165 million in February.
This is generally trending down, but is still high.
There are still signs of slack (as example, part time workers for economic reasons and elevated U-6), but there also signs the labor market is tightening. Overall this was another solid employment report.
March Employment Report: 215,000 Jobs, 5.0% Unemployment Rate
by Calculated Risk on 4/01/2016 08:42:00 AM
From the BLS:
Total nonfarm payroll employment rose by 215,000 in March, and the unemployment rate was little changed at 5.0 percent, the U.S. Bureau of Labor Statistics reported today. Employment increased in retail trade, construction, and health care. Job losses occurred in manufacturing and mining.
...
The change in total nonfarm payroll employment for January was revised from +172,000 to +168,000, and the change for February was revised from +242,000 to +245,000. With these revisions, employment gains in January and February combined were 1,000 less than previously reported.
...
In March, average hourly earnings for all employees on private nonfarm payrolls increased by 7 cents to $25.43, following a 2-cent decline in February. Over the year, average hourly earnings have risen by 2.3 percent.
emphasis added
 Click on graph for larger image.
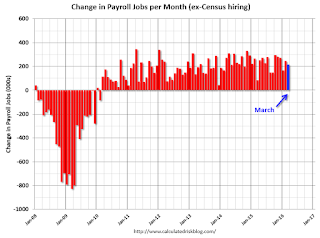
The first graph shows the monthly change in payroll jobs, ex-Census (meaning the impact of the decennial Census temporary hires and layoffs is removed - mostly in 2010 - to show the underlying payroll changes).
Total payrolls increased by 215 thousand in March (private payrolls increased 230 thousand).
Payrolls for January and February were revised down slightly by a combined 1 thousand.
 This graph shows the year-over-year change in total non-farm employment since 1968.
In March, the year-over-year change was 2.80 million jobs. A solid gain.
The third graph shows the employment population ratio and the participation rate.
 The Labor Force Participation Rate increased in March to 63.0%. This is the percentage of the working age population in the labor force. A large portion of the recent decline in the participation rate is due to demographics.
 The Employment-Population ratio increased to 59.9% (black line).
I'll post the 25 to 54 age group employment-population ratio graph later.
 The fourth graph shows the unemployment rate.
 The unemployment rate was increased in March to 5.0%.
This was slightly above expectations of 210,000 jobs, and is another strong report.
I'll have much more later ...
Thursday, March 31, 2016
Freddie Mac: Mortgage Serious Delinquency rate decreased in February, Lowest since Sept 2008
by Calculated Risk on 3/31/2016 06:56:00 PM
Friday:
• At 8:30 AM ET, Employment Report for March. The consensus is for an increase of 210,000 non-farm payroll jobs added in March, down from the 242,000 non-farm payroll jobs added in February. The consensus is for the unemployment rate to be unchanged at 4.9%.
• At 10:00 AM, the ISM Manufacturing Index for March. The consensus is for the ISM to be at 50.5, up from 49.5 in February. The ISM manufacturing index indicated contraction at 49.5% in February. The employment index was at 48.5%, and the new orders index was at 51.5%.
• Also at 10:00 AM, Construction Spending for February. The consensus is for a 0.2% increase in construction spending.
• Also at 10:00 AM, University of Michigan's Consumer sentiment index (final for March). The consensus is for a reading of 90.9, up from the preliminary reading 91.0.
• All day: Light vehicle sales for March. The consensus is for light vehicle sales to increase to 17.6 million SAAR in March from 17.5 million in February (Seasonally Adjusted Annual Rate).
On Freddie:
Freddie Mac reported that the Single-Family serious delinquency rate decreased in February to 1.26% from 1.33% in January. Freddie's rate is down from 1.81% in February 2015. This is the lowest rate since September 2008.
Freddie's serious delinquency rate peaked in February 2010 at 4.20%.
These are mortgage loans that are "three monthly payments or more past due or in foreclosure".
Note: Fannie Mae reported yesterday.

Although the rate is generally declining, the "normal" serious delinquency rate is under 1%.
The serious delinquency rate has fallen 0.55 percentage points over the last year, and at that rate of improvement, the serious delinquency rate will not be below 1% until the second half of this year.
I expect an above normal level of Fannie and Freddie distressed sales through 2016 (mostly in judicial foreclosure states).
Preview: Employment Report for March
by Calculated Risk on 3/31/2016 01:47:00 PM
On Friday at 8:30 AM ET, the BLS will release the employment report for March. The consensus, according to Bloomberg, is for an increase of 210,000 non-farm payroll jobs in March (with a range of estimates between 175,000 to 241,000), and for the unemployment rate to be unchanged at 4.9%.
The BLS reported 242,000 jobs added in February.
Here is a summary of recent data:
• The ADP employment report showed an increase of 200,000 private sector payroll jobs in March. This was close to expectations of 203,000 private sector payroll jobs added. The ADP report hasn't been very useful in predicting the BLS report for any one month, but in general, this suggests employment growth close to expectations.
• Since the employment report is being released on the 1st of April, the March ISM manufacturing and non-manufacturing employment indexes are not available yet, and will be released after the employment report this month.
• Initial weekly unemployment claims averaged close to 263,000 in March, about the same as in February. For the BLS reference week (includes the 12th of the month), initial claims were at 265,000, up slightly from 262,000 during the reference week in February.
This suggests about the same level of layoffs in March as in February (very few).
• The preliminary March University of Michigan consumer sentiment index decreased to 90.0 from the February reading of 91.7. Sentiment is frequently coincident with changes in the labor market, but there are other factors too - like lower gasoline prices.
• Conclusion: Some of the usual indicators will be released after the employment report this month. The available data suggests job growth in the 200 thousand plus range again in March.
Goldman: March Payrolls Preview
by Calculated Risk on 3/31/2016 11:45:00 AM
A few excerpts from a note by Goldman Sachs economist David Mericle: March Payrolls Preview
We expect a 220k gain in nonfarm payroll employment in March, above consensus expectations for a 205k increase and in line with the average rate of employment growth over the last year. A further decline in jobless claims and improvements in the employment components of most business surveys were the highlights of the overall improvement in labor market indicators in March.
The unemployment rate is likely to remain unchanged at 4.9%, with risks to the downside. Average hourly earnings are likely to rise at a trend-like pace of 0.2% this month, with a rebound from last month’s surprisingly soft print offset by negative calendar effects.
Chicago PMI increases to 53.6
by Calculated Risk on 3/31/2016 09:52:00 AM
Chicago PMI: March Chicago Business Barometer Up 6.0 Points to 53.6
The Chicago Business Barometer increased 6.0 points to 53.6 in March, led by sharp bouncebacks in Production and Employment.This was above the consensus forecast of 50.3.
...
The increase in the Barometer was led by a very sharp rise in Production, which followed an even steeper decline in the previous month. The biggest surprise came from the Employment component which rose above the 50 mark in March and to the highest level since April 2015.
...
Chief Economist of MNI Indicators Philip Uglow said, “The most signficant result from the March survey is the pick-up in the Employment component which has remained weak for much of the past year. Looking through some of the recent volatility, the data are consistent with steady, not spectacular, economic growth in the US.“
emphasis added
Weekly Initial Unemployment Claims increase to 276,000
by Calculated Risk on 3/31/2016 08:34:00 AM
The DOL reported:
In the week ending March 26, the advance figure for seasonally adjusted initial claims was 276,000, an increase of 11,000 from the previous week's unrevised level of 265,000. The 4-week moving average was 263,250, an increase of 3,500 from the previous week's unrevised average of 259,750.The previous week was unrevised.
There were no special factors impacting this week's initial claims. This marks 56 consecutive weeks of initial claims below 300,000, the longest streak since 1973.
Note: The following graph shows the 4-week moving average of weekly claims since 1971.
 Click on graph for larger image.
The dashed line on the graph is the current 4-week average. The four-week average of weekly unemployment claims increased to 263,250.
This was above the consensus forecast of 266,000. The low level of the 4-week average suggests few layoffs.
Wednesday, March 30, 2016
Thursday: Unemployment Claims, Chicago PMI
by Calculated Risk on 3/30/2016 06:40:00 PM
From Merrill Lynch on March payroll report:
The March employment report likely showed another strong month for the labor market. We anticipate a healthy 190,000 gain in nonfarm payrolls, with the private sector contributing 185,000. Job cuts likely continued in the mining sector given low oil prices. Meanwhile, early signs from the manufacturing sector point to a rebound in activity this month, so we may see a pick-up in hiring after the decline in February. Elsewhere, construction and services likely saw further healthy gains.Thursday:
We expect the unemployment rate to hold in at 4.9% ... there is a risk that the unemployment rate heads lower to 4.8%. On wages, we think average hourly earnings posted a nice 0.3% mom gain, reversing the 0.1% decline previously. This would leave the yoy rate unchanged at 2.2%.
• At 8:30 AM ET, The initial weekly unemployment claims report will be released. The consensus is for 266 thousand initial claims, up from 265 thousand the previous week.
• At 9:45 AM, Chicago Purchasing Managers Index for March. The consensus is for a reading of 50.3, up from 47.6 in February.
Fannie Mae: Mortgage Serious Delinquency rate declined in February, Lowest since July 2008
by Calculated Risk on 3/30/2016 04:41:00 PM
Fannie Mae reported today that the Single-Family Serious Delinquency rate declined in February to 1.52%, down from 1.55% in January. The serious delinquency rate is down from 1.83% in February 2015.
This is the lowest rate since July 2008.
The Fannie Mae serious delinquency rate peaked in February 2010 at 5.59%.
Note: These are mortgage loans that are "three monthly payments or more past due or in foreclosure".
Note: Freddie Mac has not reported for February yet.

The Fannie Mae serious delinquency rate has only fallen 0.31 percentage points over the last year - the pace of improvement has slowed - and at that pace the serious delinquency rate will not be below 1% until 2017.
The "normal" serious delinquency rate is under 1%, so maybe Fannie Mae serious delinquencies will be close to normal some time in 2017. This elevated delinquency rate is mostly related to older loans - the lenders are still working through the backlog.


