by Calculated Risk on 4/06/2016 02:10:00 PM
Wednesday, April 06, 2016
FOMC Minutes: Many participants argued "asymmetry made it prudent to wait for additional information"
There were different views - a couple of members expect to raise rates at the next meeting. However many participants argued for a cautious approach.
From the Fed: Minutes of the Federal Open Market Committee, March 15-16, 2016. Excerpts:
Participants generally agreed that the incoming information indicated that the U.S. economy had been resilient to recent global economic and financial developments, and that the domestic economic indicators that had become available in recent weeks had been mostly consistent with their expectations. Moreover, the sharp asset price movements that occurred earlier in the year had been reversed to a large extent, but longer-term interest rates and market participants' expectations for the future path of the federal funds rate remained lower. Taking these developments into account, participants generally judged that the medium-term outlook for domestic demand was not appreciably different than it had been when the Committee met in December. However, most participants, while recognizing the likely positive effects of recent policy actions abroad, saw foreign economic growth as likely to run at a somewhat slower pace than previously expected, a development that probably would further restrain growth in U.S. exports and tend to damp overall aggregate demand. Several participants also cited wider credit spreads as a factor that was likely to restrain growth in demand. Accordingly, many participants expressed the view that a somewhat lower path for the federal funds rate than they had projected in December now seemed most likely to be appropriate for achieving the Committee's dual mandate. Many participants also noted that a somewhat lower projected interest rate path was one reason for the relatively small revisions in their medium-term projections for economic activity, unemployment, and inflation.
Several participants also argued for proceeding cautiously in reducing policy accommodation because they saw the risks to the U.S. economy stemming from developments abroad as tilted to the downside or because they were concerned that longer-term inflation expectations might be slipping lower, skewing the risks to the outlook for inflation to the downside. Many participants noted that, with the target range for the federal funds rate only slightly above zero, the FOMC continued to have little room to ease monetary policy through conventional means if economic activity or inflation turned out to be materially weaker than anticipated, but could raise rates quickly if the economy appeared to be overheating or if inflation was to increase significantly more rapidly than anticipated. In their view, this asymmetry made it prudent to wait for additional information regarding the underlying strength of economic activity and prospects for inflation before taking another step to reduce policy accommodation.
For all of these reasons, most participants judged it appropriate to maintain the target range for the federal funds rate at 1/4 to 1/2 percent at this meeting while noting that global economic and financial developments continued to pose risks. These participants saw their judgment as consistent with the Committee's data-dependent approach to setting monetary policy; it was noted that, in this context, the relevant data include not only domestic economic releases, but also information about developments abroad and changes in financial conditions that bear on the economic outlook. A couple of participants, however, saw an increase in the target range to 1/2 to 3/4 percent as appropriate at this meeting, citing evidence that the economy was continuing to expand at a moderate rate despite developments abroad and earlier volatility in financial conditions, continued improvement in labor market conditions, the firming of inflation over recent months, and the apparent leveling-off of oil prices. In their judgment, increasing the target range for the federal funds rate too gradually in the near term risked having to raise it quickly later, which could cause economic and financial strains at that time.
Participants agreed that their ongoing assessments of the data and the implications for the outlook, rather than calendar dates, would determine the timing and pace of future adjustments to the stance of monetary policy. They expressed a range of views about the likelihood that incoming information would make an adjustment appropriate at the time of their next meeting. A number of participants judged that the headwinds restraining growth and holding down the neutral rate of interest were likely to subside only slowly. In light of this expectation and their assessment of the risks to the economic outlook, several expressed the view that a cautious approach to raising rates would be prudent or noted their concern that raising the target range as soon as April would signal a sense of urgency they did not think appropriate. In contrast, some other participants indicated that an increase in the target range at the Committee's next meeting might well be warranted if the incoming economic data remained consistent with their expectations for moderate growth in output, further strengthening of the labor market, and inflation rising to 2 percent over the medium term.
emphasis added
Las Vegas Real Estate in March: Sales Increased 4% YoY, Inventory Declines
by Calculated Risk on 4/06/2016 12:41:00 PM
This is a key distressed market to follow since Las Vegas has seen the largest price decline of any of the Case-Shiller composite 20 cities.
The Greater Las Vegas Association of Realtors reported Southern Nevada Home Prices and Sales Rise while Supply Stays Tight, GLVAR Reports
According to GLVAR, the total number of existing local homes, condominiums and townhomes sold in March was 3,488, up from a strong showing of 3,358 in March of 2015. Compared to the same month one year ago, 2.8 percent more homes and 8.3 percent more condos and townhomes sold in March.1) Overall sales were up 3.9% year-over-year.
...
By the end of March, GLVAR reported 7,214 single-family homes listed without any sort of offer. That’s down 0.6 percent from one year ago. For condos and townhomes, the 2,304 properties listed without offers in March represented a 5.8 percent decrease from one year ago.
GLVAR continued to report declines in distressed sales and a corresponding increase in traditional home sales, where lenders are not controlling the transaction. In March, 5.9 percent of all local sales were short sales – when lenders allow borrowers to sell a home for less than what they owe on the mortgage. That’s down from 8.3 percent of all sales one year ago. Another 7.1 percent of all March sales were bank-owned, down from 9.3 percent one year ago.
emphasis added
2) The percent of cash sales decreased year-over-year from 32.4% in Mar 2015 to 27.7% in Mar 2016. This has been trending down.
3) Non-contingent inventory for single-family homes was down 0.6% year-over-year. Inventory is important to watch - and inventory is still tight.
Reis: Mall Vacancy Rate unchanged in Q1 2016
by Calculated Risk on 4/06/2016 09:53:00 AM
Reis reported that the vacancy rate for regional malls was unchanged at 7.8% in Q1 2016 compared to Q4 2015, and down slightly year-over-year from 7.9% in Q1 2015. This is down from a cycle peak of 9.4% in Q3 2011.
For Neighborhood and Community malls (strip malls), the vacancy rate was also unchanged at 10.0% in Q1 2016 compared to Q4, and down year-over-year from 10.1% in Q1 2015. For strip malls, the vacancy rate peaked at 11.1% in Q3 2011.
Comments from Reis Senior Economist and Director of Research Ryan Severino:
The national vacancy rate for neighborhood and community shopping centers was unchanged during the first quarter at 10.0%. Although the national vacancy rate technically did not decline, net absorption continues to exceed new construction, a heartening sign for a market that remains mired in a slow but steady recovery. The vacancy rate for malls also did not change, remaining at 7.8%. For neighborhood and community centers, the flat vacancy rate is just a blip, with more vacancy compression likely ahead. However, for regional malls, the vacancy compression cycle has largely ended.
While results from the first quarter have not shown any acceleration in the retail recovery, the overall economic environment remains conducive to further improvement. The labor market continues to generate more than 200,000 jobs per month on average, wages are slowly but surely inching higher, and retail sales continue to grow. Although the retail market clearly has no shortage of challenges - from e-commerce to new subtypes to experiential shopping - there is no reason to think that the recovery will not persist during the balance of 2016, even if the pace of the recovery does not accelerate much.
...
Asking and effective rents grew by 0.5% and 0.6% respectively during the first quarter. Quarterly rental growth rates for neighborhood and community centers have been virtually identical for the last six quarters. Consequently, the year-over-year growth rates have also changed very little in recent quarters, with asking and effective rents having grown by 2.1% and 2.2% respectively. Much like with new construction, the linchpin for rent growth is demand, or more specifically greater demand. Until net absorption rises to more robust levels, rent growth will remain stuck near current levels, more or less in line with core inflation. Nonetheless, rental growth is still the strongest it has been since 2007. Admittedly, that is not a high hurdle to clear, but slow progress is still progress.
emphasis added
 Click on graph for larger image.
This graph shows the strip mall vacancy rate starting in 1980 (prior to 2000 the data is annual). The regional mall data starts in 2000. Back in the '80s, there was overbuilding in the mall sector even as the vacancy rate was rising. This was due to the very loose commercial lending that led to the S&L crisis.
In the mid-'00s, mall investment picked up as mall builders followed the "roof tops" of the residential boom (more loose lending). This led to the vacancy rate moving higher even before the recession started. Then there was a sharp increase in the vacancy rate during the recession and financial crisis.
Currently the vacancy rate is declining slowly and remains at an elevated level.
Mall vacancy data courtesy of Reis.
MBA: "Refinance Applications Drive Increase in Latest MBA Weekly Survey"
by Calculated Risk on 4/06/2016 07:00:00 AM
From the MBA: Refinance Applications Drive Increase in Latest MBA Weekly Survey
Mortgage applications increased 2.7 percent from one week earlier, according to data from the Mortgage Bankers Association’s (MBA) Weekly Mortgage Applications Survey for the week ending April 1, 2016.
...
The Refinance Index increased 7 percent from the previous week. The seasonally adjusted Purchase Index decreased 2 percent from one week earlier. The unadjusted Purchase Index decreased 2 percent compared with the previous week and was 11 percent higher than the same week one year ago.
emphasis added
 Click on graph for larger image.
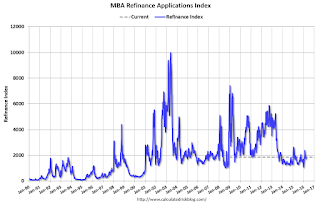
The first graph shows the refinance index since 1990.
Refinance activity was higher in 2015 than in 2014, but it was still the third lowest year since 2000.
Refinance activity picked up earlier in 2016 as rates declined.
 The second graph shows the MBA mortgage purchase index.
 According to the MBA, the unadjusted purchase index is 11% higher than a year ago.
Tuesday, April 05, 2016
Goldman: "Household Formation Close to Normal"
by Calculated Risk on 4/05/2016 08:01:00 PM
Wednesday:
• Early: Reis Q1 2016 Mall Survey of rents and vacancy rates.
• At 7:00 AM ET, The Mortgage Bankers Association (MBA) will release the results for the mortgage purchase applications index.
• At 2:00 PM, The Fed will release the FOMC Minutes for the Meeting of March 15-16, 2016
A few excerpts from a note by Goldman Sachs economists Hui Shan and Daan Struyven: Household Formation Close to Normal
Looking across various measures, we find that household formation has improved over the past few years and likely exceeded 1 million in 2015—an encouraging rebound from the subdued pace in years prior.
We continue to forecast an annual household formation rate of 1.2 million over the next few years. This forecast, coupled with the decline in the vacancy rate, supports our constructive view on homebuilding. Overall, we see continued evidence that housing will remain a tailwind to the economy.
Earlier: ISM Non-Manufacturing Index increased to 54.5% in March
by Calculated Risk on 4/05/2016 03:41:00 PM
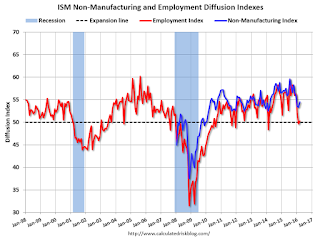
The March ISM Non-manufacturing index was at 54.5%, up from 53.4% in February. The employment index increased in March to 50.3%, up from 49.7% in February. Note: Above 50 indicates expansion, below 50 contraction.
From the Institute for Supply Management:March 2016 Non-Manufacturing ISM Report On Business®
Economic activity in the non-manufacturing sector grew in March for the 74th consecutive month, say the nation's purchasing and supply executives in the latest Non-Manufacturing ISM® Report On Business®.
The report was issued today by Anthony Nieves, CPSM, C.P.M., CFPM, chair of the Institute for Supply Management® (ISM®) Non-Manufacturing Business Survey Committee. "The NMI® registered 54.5 percent in March, 1.1 percentage points higher than the February reading of 53.4 percent. This represents continued growth in the non-manufacturing sector at a slightly faster rate. The Non-Manufacturing Business Activity Index increased to 59.8 percent, 2 percentage points higher than the February reading of 57.8 percent, reflecting growth for the 80th consecutive month, with a faster rate in March. The New Orders Index registered 56.7 percent, 1.2 percentage points higher than the reading of 55.5 percent in February. The Employment Index increased 0.6 percentage point to 50.3 percent from the February reading of 49.7 percent and indicates growth after a month of contraction. The Prices Index increased 3.6 percentage points from the February reading of 45.5 percent to 49.1 percent, indicating prices decreased in March for the fifth time in the last seven months. According to the NMI®, 12 non-manufacturing industries reported growth in March. The majority of respondents’ comments indicate that business conditions are mostly positive and that the economy is stable and will continue on a course of slow, steady growth."
emphasis added
 Click on graph for larger image.
This graph shows the ISM non-manufacturing index (started in January 2008) and the ISM non-manufacturing employment diffusion index.
This was above the consensus forecast of 54.0, and suggests faster expansion in March than in February.
Reis: Apartment Vacancy Rate increased in Q1 to 4.5%
by Calculated Risk on 4/05/2016 12:41:00 PM
Reis reported that the apartment vacancy rate increased in Q1 2016 to 4.5%, up from 4.4% in Q4, and up from 4.3% in Q1 2015. The vacancy rate peaked at 8.0% at the end of 2009, and bottomed at 4.2% in 2014 and early 2015.
A few comments from Reis Senior Economist and Director of Research Ryan Severino:
If there were any doubts about rising vacancy in the apartment market they should now be put to rest. The national vacancy rate increased once again during the first quarter, marking three consecutive quarters of national vacancy rate increases. This is the first time this has occurred since the fourth quarter of 2009 when the apartment market was still struggling due to the fallout from the Great Recession. This is the beginning of an upward trend in vacancy that should persist for at least the next five years. New construction continues to exceed net absorption by a wider margin over time which will cause vacancy to increase in the majority (if not all) of the coming quarters. While the apartment market should still remain tight, there is clearly not a bottomless pool of demand that absorbs all of the units that are being delivered to the market.
Vacancy once again increased by 10 basis points to 4.5% during the first quarter with construction exceeding net absorption. Demand and supply are now clearly out of balance, a dynamic that should persist for the foreseeable future. If anything, there will be greater upward pressure exerted on the national vacancy rate because construction is likely to exceed demand by an increasingly wider amount over time. During the first quarter construction exceed demand by 10,931 units. Although this difference is narrower than the previous quarter, it remains significant. With construction set to increase faster than net absorption this difference should continue to widen in the coming quarters.
...
Asking and effective rents grew by 0.4% and 0.5% respectively during the first quarter. This is a noticeable decline relative to strength in rental growth that occurred during the last few quarters. Although seasonality plays some role in this, the rising vacancy rate due to increasing levels of new construction is likely amplifying those seasonal impacts. Nonetheless, rent growth should bounce back during the warmer middle quarters of this year when demand for apartments is typically stronger. However it is noteworthy that these were the weakest quarterly rent growth figures since the fourth quarter of 2011 when the market was not as tight with the national vacancy rate roughly 80 basis points above where it was during the first quarter of 2016.
Over the last 12 months, asking and effective rents both grew by 4.5%. This is roughly in line with what occurred during calendar year 2015 and is still the strongest over a 12-month period since 2007 before the recession. Even with rent growth likely to rebound in the coming quarters, the relatively weak first-quarter reading could cause rent growth during 2016 to be below that of 2015.
emphasis added
 Click on graph for larger image.
This graph shows the apartment vacancy rate starting in 1980. (Annual rate before 1999, quarterly starting in 1999). Note: Reis is just for large cities.
The vacancy rate had been mostly moving sideways for the last few years. Now that completions are catching up with starts, the vacancy rate has started to increase.
Apartment vacancy data courtesy of Reis.
BLS: Jobs Openings "little changed" in February
by Calculated Risk on 4/05/2016 10:08:00 AM
From the BLS: Job Openings and Labor Turnover Summary
The number of job openings was little changed at 5.4 million on the last business day of February, the U.S. Bureau of Labor Statistics reported today. Hires increased to 5.4 million while separations were little changed at 5.1 million. Within separations, the quits rate was 2.1 percent, and the layoffs and discharges rate was 1.2 percent. ...The following graph shows job openings (yellow line), hires (dark blue), Layoff, Discharges and other (red column), and Quits (light blue column) from the JOLTS.
...
The number of quits was little changed in February at 3.0 million. The quits rate was 2.1 percent.
emphasis added
This series started in December 2000.
Note: The difference between JOLTS hires and separations is similar to the CES (payroll survey) net jobs headline numbers. This report is for February, the most recent employment report was for March.
 Click on graph for larger image.
Note that hires (dark blue) and total separations (red and light blue columns stacked) are pretty close each month. This is a measure of labor market turnover. When the blue line is above the two stacked columns, the economy is adding net jobs - when it is below the columns, the economy is losing jobs.
Jobs openings decreased in February to 5.445 million from 5.604 million in January.
The number of job openings (yellow) are up 6% year-over-year compared to February 2015.
Quits are up 9% year-over-year. These are voluntary separations. (see light blue columns at bottom of graph for trend for "quits").
This is another solid report, and job openings are just below the record high set in July 2015.
CoreLogic: House Prices up 6.8% Year-over-year in February
by Calculated Risk on 4/05/2016 09:02:00 AM
Notes: This CoreLogic House Price Index report is for February. The recent Case-Shiller index release was for January. The CoreLogic HPI is a three month weighted average and is not seasonally adjusted (NSA).
From CoreLogic: CoreLogic US Home Price Report Shows Home Prices Up 6.8 Percent Year Over Year in February 2016
Home prices nationwide, including distressed sales, increased year over year by 6.8 percent in February 2016 compared with February 2015 and increased month over month by 1.1 percent in February 2016 compared with January 2016, according to the CoreLogic HPI.
...
“Fixed-rate mortgage rates dropped more than one-quarter of a percentage point in the first three months of 2016, and job creation averaged 209,000 over the same period,” said Dr. Frank Nothaft, chief economist for CoreLogic. “These economic forces will sustain home purchases during the spring and support the 5.2 percent home price appreciation CoreLogic has projected for the next year.”
emphasis added
 Click on graph for larger image.
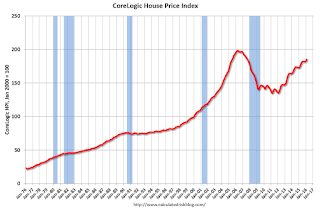
 This graph shows the national CoreLogic HPI data since 1976. January 2000 = 100.
The index was up 1.1% in February (NSA), and is up 6.8% over the last year.
This index is not seasonally adjusted, and this was a solid month-to-month increase.
The index is still 6.5% below the bubble peak in nominal terms (not inflation adjusted).
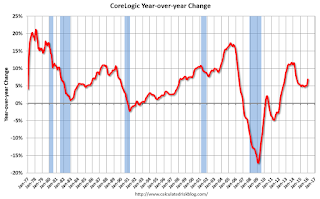
 The second graph shows the YoY change in nominal terms (not adjusted for inflation).
The YoY increase had been moving sideways over the last year, but has picked up a recently.
The year-over-year comparison has been positive for forty eight consecutive months.
Trade Deficit Increased in February to $47.1 Billion
by Calculated Risk on 4/05/2016 08:41:00 AM
The Department of Commerce reported:
The U.S. Census Bureau and the U.S. Bureau of Economic Analysis, through the Department of Commerce, announced today that the goods and services deficit was $47.1 billion in February, up $1.2 billion from $45.9 billion in January, revised. February exports were $178.1 billion, $1.8 billion more than January exports. February imports were $225.1 billion, $3.0 billion more than January imports.The trade deficit was larger than the consensus forecast of $46.2 billion.
The first graph shows the monthly U.S. exports and imports in dollars through February 2016.
 Click on graph for larger image.
Imports increased and exports increased in February.
Exports are 7% above the pre-recession peak and down 4% compared to February 2015; imports are 3% below the pre-recession peak, and unchanged compared to February 2015.
The second graph shows the U.S. trade deficit, with and without petroleum.
 The blue line is the total deficit, and the black line is the petroleum deficit, and the red line is the trade deficit ex-petroleum products.
Oil imports averaged $27.48 in February, down from $32.06 in January, and down from $49.53 in February 2015. The petroleum deficit has generally been declining and is the major reason the overall deficit has declined a little since early 2012.
The trade deficit with China increased to $28.1 billion in February, from $22.5 billion in February 2015 (there was a port slowdown last year impacting imports). The deficit with China is a substantial portion of the overall deficit.


