by Calculated Risk on 5/18/2016 07:00:00 AM
Wednesday, May 18, 2016
MBA: "Mortgage Applications Decrease in Latest MBA Weekly Survey"
From the MBA: Mortgage Applications Decrease in Latest MBA Weekly Survey
Mortgage applications decreased 1.6 percent from one week earlier, according to data from the Mortgage Bankers Association’s (MBA) Weekly Mortgage Applications Survey for the week ending May 13, 2016.
...
The Refinance Index increased 1 percent from the previous week. The seasonally adjusted Purchase Index decreased 6 percent from one week earlier to the lowest level since February 2016. The unadjusted Purchase Index decreased 6 percent compared with the previous week and was 12 percent higher than the same week one year ago.
...
The average contract interest rate for 30-year fixed-rate mortgages with conforming loan balances ($417,000 or less) remained unchanged at 3.82 percent, with points unchanged at 0.34 (including the origination fee) for 80 percent loan-to-value ratio (LTV) loans. The effective rate was unchanged from last week.
emphasis added
 Click on graph for larger image.
The first graph shows the refinance index since 1990.
Refinance activity was higher in 2015 than in 2014, but it was still the third lowest year since 2000.
Refinance activity increased a little this year when rates declined.
 The second graph shows the MBA mortgage purchase index.
 According to the MBA, the unadjusted purchase index is 12% higher than a year ago.
Tuesday, May 17, 2016
Wednesday: FOMC Minutes
by Calculated Risk on 5/17/2016 06:54:00 PM
Wednesday:
• At 7:00 AM ET, The Mortgage Bankers Association (MBA) will release the results for the mortgage purchase applications index.
• During the day: The AIA's Architecture Billings Index for April (a leading indicator for commercial real estate).
• At 2:00 PM, the Fed will release the FOMC Minutes for the meeting of April 26-27, 2016
From Tim Duy: Fed Officials Come Looking For A Fight
[A] non-trivial contingent of the Fed does not want to leave June off the table. That is a message that came thorough loud and clear today. ... there is a message here - many FOMC participants want to go into the June meeting with a reasonable chance that they will hike rates. They don't want the outcome of this meeting to be a foregone conclusion.
...
The more hawkish Fedspeak could be foreshadowing that the minutes of the April FOMC meeting will have a hawkish tilt.
...
Bottom Line: Today's Fed speakers came looking for a fight with financial market participants. They don't like the low odds assigned to the June meeting. I don't think June is a go; the data isn't quite there yet. But odds are greater than 15%, in my opinion.
emphasis added
Comments on April Housing Starts
by Calculated Risk on 5/17/2016 04:11:00 PM
Earlier: Housing Starts increased to 1.172 Million Annual Rate in April
The housing starts report this morning was above consensus, and there were upward revisions to the prior three months. However starts were down 1.7% from April 2015, but April was strong last year (see the first graph).
The key take away from the report is that multi-family is slowing, and single family growth is ongoing year-over-year.
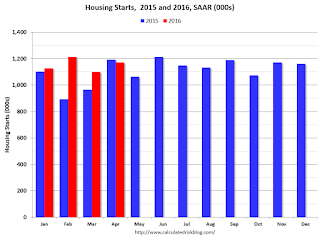
This graph shows the month to month comparison between 2015 (blue) and 2016 (red).
The comparison for April was more difficult than in February and March.
Year-to-date starts are up 10.2% compared to the same period in 2015, but that will slow further with the more difficult comparisons for the remainder of the year.
Multi-family starts are down 2.3% year-to-date, and single-family starts are up 16.8% year-to-date.
Below is an update to the graph comparing multi-family starts and completions. Since it usually takes over a year on average to complete a multi-family project, there is a lag between multi-family starts and completions. Completions are important because that is new supply added to the market, and starts are important because that is future new supply (units under construction is also important for employment).
These graphs use a 12 month rolling total for NSA starts and completions.

The rolling 12 month total for starts (blue line) increased steadily over the last few years, and completions (red line) have lagged behind - but completions have been catching up (more deliveries), and will continue to follow starts up (completions lag starts by about 12 months).
Multi-family completions are increasing sharply year-over-year.
I think most of the growth in multi-family starts is probably behind us - in fact multi-family starts probably peaked in June 2015 (at 510 thousand SAAR) - although I expect solid multi-family starts for a few more years (based on demographics).

Note the exceptionally low level of single family starts and completions. The "wide bottom" was what I was forecasting several years ago, and now I expect several years of increasing single family starts and completions.
The housing recovery continues, but I expect most of the growth will be from single family going forward.
Lawler: Early Look at Existing Home Sales in April
by Calculated Risk on 5/17/2016 01:21:00 PM
From housing economist Tom Lawler:
Based on publicly-available state and local realtor/MLS reports released through today, I project that US existing home sales as estimated by the National Association of Realtors ran at a seasonally adjusted annual rate of 5.44 million in April, up 2.1% from March’s preliminary pace, and up 5.8% from last April’s seasonally adjusted pace. On the inventory front, national home listings typically show a sizable seasonal increase from March to April, and local realtor/MLS data suggest that was the case last month. However, these data suggest that this April’s increase was noticeable smaller than last April’s gain, and I project that the NAR’s estimate for the number of existing homes for sale at the end of April will be 2.10 million, up 6.1% from March’s preliminary estimate but down 5.4% from last April.
Finally, local/realtor/MLS data suggest that the NAR’s estimate of the median existing single-family home sales price in April will be up by about 6.0% from last April.
While home sales in most areas of the country last month were higher than last April, there were a few notable exceptions. For example, homes sales in both the Portland, Oregon area and in the Denver, Colorado area – which have been “hot” and where home prices have increased substantially over the past two years – were down from a year ago last month. In both areas the “months’ supply” of homes for sale has been incredibly low, and in both areas active listings increased sharply on the month, though from extremely low levels. Existing home sales were also down sharply from a year ago in the Bay Area of California, where prices have also increased sharply over the past few years and where the months’ supply of homes for sale has been extremely low. Realtors “blame” last month’s slow sales pace in these areas not simply to the low overall inventory of homes for sale, but mainly to the exceptionally low inventory levels of “affordable” homes for sale.
In Texas, the sizable divergence in sales trends by different areas continued, as residential sales in the “North Texas” area (which includes the Dallas-Fort Worth area) last month were up by over 14% YOY, while sales in the Houston area were down by almost 2% YOY.
CR Note: The NAR is scheduled to release April existing home sales on Friday, and the consensus is for 5.40 million SAAR.
Key Measures Show Inflation close to 2% in April
by Calculated Risk on 5/17/2016 11:15:00 AM
The Cleveland Fed released the median CPI and the trimmed-mean CPI this morning:
According to the Federal Reserve Bank of Cleveland, the median Consumer Price Index rose 0.3% (3.4% annualized rate) in April. The 16% trimmed-mean Consumer Price Index rose 0.2% (2.5% annualized rate) during the month. The median CPI and 16% trimmed-mean CPI are measures of core inflation calculated by the Federal Reserve Bank of Cleveland based on data released in the Bureau of Labor Statistics' (BLS) monthly CPI report.Note: The Cleveland Fed has the median CPI details for April here. Motor fuel was up 152% annualized in April!
Earlier today, the BLS reported that the seasonally adjusted CPI for all urban consumers rose 0.4% (5.0% annualized rate) in April. The CPI less food and energy rose 0.2% (2.4% annualized rate) on a seasonally adjusted basis.
 Click on graph for larger image.
This graph shows the year-over-year change for these four key measures of inflation. On a year-over-year basis, the median CPI rose 2.5%, the trimmed-mean CPI rose 2.0%, and the CPI less food and energy also rose 2.1%. Core PCE is for March and increased 1.6% year-over-year.
On a monthly basis, median CPI was at 3.4% annualized, trimmed-mean CPI was at 2.5% annualized, and core CPI was at 2.4% annualized.
On a year-over-year basis, three of these measures are at or above 2%.
Using these measures, inflation has been moving up, and most are close to the Fed's target (Core PCE is still below).
Fed: Industrial Production increased 0.7% in April
by Calculated Risk on 5/17/2016 09:26:00 AM
From the Fed: Industrial production and Capacity Utilization
Industrial production increased 0.7 percent in April after decreasing in the previous two months. Manufacturing output rose 0.3 percent after declining the same amount in March. The index for utilities jumped 5.8 percent in April, as the demand for electricity and natural gas returned to a more normal level after being suppressed by warmer-than-usual weather in March. Mining production fell 2.3 percent in April, and it has decreased more than 1 1/2 percent per month, on average, over the past eight months. At 104.1 percent of its 2012 average, total industrial production in April was 1.1 percent below its year-earlier level. Capacity utilization for the industrial sector increased 0.5 percentage point in April to 75.4 percent, a rate that is 4.6 percentage points below its long-run (1972–2015) average.
emphasis added
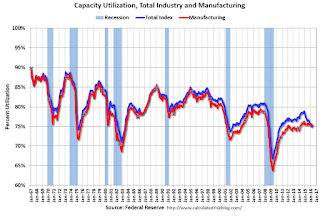 Click on graph for larger image.
This graph shows Capacity Utilization. This series is up 8.7 percentage points from the record low set in June 2009 (the series starts in 1967).
Capacity utilization at 75.4% is 4.6% below the average from 1972 to 2015 and below the pre-recession level of 80.8% in December 2007.
Note: y-axis doesn't start at zero to better show the change.
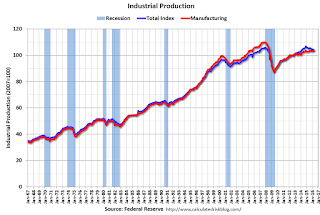 The second graph shows industrial production since 1967.
Industrial production increased 0.6% in April to 104.1. This is 19.1% above the recession low, and 1.5% below the pre-recession peak.
This was above expectations of a 0.2% increase.
Housing Starts increased to 1.172 Million Annual Rate in April
by Calculated Risk on 5/17/2016 08:39:00 AM
From the Census Bureau: Permits, Starts and Completions
Housing Starts:
Privately-owned housing starts in April were at a seasonally adjusted annual rate of 1,172,000. This is 6.6 percent above the revised March estimate of 1,099,000, but is 1.7 percent below the April 2015 rate of 1,192,000.
Single-family housing starts in April were at a rate of 778,000; this is 3.3 percent above the revised March figure of 753,000. The April rate for units in buildings with five units or more was 373,000.
Building Permits:
Privately-owned housing units authorized by building permits in April were at a seasonally adjusted annual rate of 1,116,000. This is 3.6 percent above the revised March rate of 1,077,000, but is 5.3 percent below the April 2015 estimate of
Single-family authorizations in April were at a rate of 736,000; this is 1.5 percent above the revised March figure of 725,000. Authorizations of units in buildings with five units or more were at a rate of 348,000 in April.
emphasis added
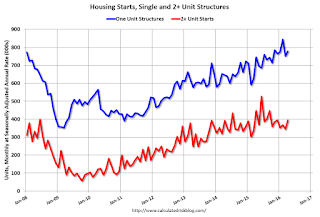 Click on graph for larger image.
The first graph shows single and multi-family housing starts for the last several years.
Multi-family starts (red, 2+ units) increased in April compared to March. Multi-family starts are down 12% year-over-year.
Single-family starts (blue) increased in April, and are up 4% year-over-year.
 The second graph shows total and single unit starts since 1968.
 The second graph shows the huge collapse following the housing bubble, and then - after moving sideways for a couple of years - housing is now recovering (but still historically low),
Total housing starts in April were above expectations, and combined starts for February and March were revised up. I'll have more later ...
Monday, May 16, 2016
Tuesday: Housing Starts, CPI, Industrial Production
by Calculated Risk on 5/16/2016 05:52:00 PM
Tuesday:
• At 8:30 AM ET, Housing Starts for April. Total housing starts decreased to 1.089 million (SAAR) in March. Single family starts decreased to 764 thousand SAAR in March. The consensus for 1.135 million, up from the March rate.
• Also at 8:30 AM, The Consumer Price Index for May from the BLS. The consensus is for a 0.3% increase in CPI, and a 0.2% increase in core CPI.
• At 9:15 AM, The Fed will release Industrial Production and Capacity Utilization for April. The consensus is for a 0.2% increase in Industrial Production, and for Capacity Utilization to increase to 74.9%.
From Matthew Graham at Mortgage News Daily: Mortgage Rates Surprisingly Steady Despite Market Volatility
Mortgage rates held surprisingly steady today, even though underlying bond markets were in noticeably weaker territory. As bonds weaken, rates normally move higher, but there's been a bit of a disconnect recently. In light of our discussion last week, perhaps it isn't so surprising. We had anticipated that mortgage rates would start out with an advantage this week because they didn't move much lower at the end of last week even though bond markets were stronger. In other words, bond markets are suggesting rates should be right about where they were on Thursday afternoon, and that's exactly where they are.
Naturally, this means that we no longer have the same sort of implicit advantage we enjoyed on Friday afternoon heading into the weekend. As such, it's definitely safer to lean back toward locking. The most prevalently-quoted conventional 30yr fixed rate remains 3.625% on top tier scenarios, with a smattering of lenders still down at 3.5%.
emphasis added
Duy: Fed Considers June still possible for Rate Hike
by Calculated Risk on 5/16/2016 01:14:00 PM
From economist Tim Duy: Fed Not As Convinced About June As Markets
Market participants place less than 10 percent chance of a rate hike in June. In contrast, San Francisco Federal Reserve President John Williams continues hold out hope for a third.CR Note: Most analysts have moved to the September meeting as the next most likely for the next rate hike. To hike in June, I think the FOMC would need to see a pickup in key inflation measures, especially core PCE inflation in April (to be released May 31st).
...
I think the Fed increasingly believes the data is lining up in their favor. Friday's retail sales report likely went a long-way toward dispelling any lingering concerns they might have over the strength of the consumer. The tenor of that data has picked up markedly in the last few months.
...
Remember that if we assume July and October are off the table (lack of press conferences and/or proximity to election), then retaining the option to hike three times requires a hard look at June. I think that will lead to a much more extensive discussion of a rate hike at the June meeting than many market participants appear to expect.
...
Bottom Line: I don't think the data lines up to support a June rate hike. But I don't think the case will be as clear-cut as signaled by the low odds financial market participants place on a hike.
NAHB: Builder Confidence unchanged at 58 in May
by Calculated Risk on 5/16/2016 10:04:00 AM
The National Association of Home Builders (NAHB) reported the housing market index (HMI) was at 58 in May, unchanged from 58 in April. Any number above 50 indicates that more builders view sales conditions as good than poor.
From the NAHB: Builder Confidence Holds Stable in May
Builder confidence in the market for newly-built single-family homes remained unchanged in May at a level of 58 on the National Association of Home Builders/Wells Fargo Housing Market Index (HMI).
“Builder confidence has held steady at 58 for four straight months, which indicates that the single-family housing sector remains in positive territory,” said NAHB Chairman Ed Brady, a home builder and developer from Bloomington, Ill. “However, builders are facing an increasing number of regulations and lot supply constraints.”
The HMI components measuring sales expectations in the next six months increased three points to 65, while the component charting current sales conditions and the index gauging buyer traffic both held steady at 63 and 44, respectively.
“The fact that future sales expectations rose slightly this month shows that builders are confident that the market will continue to strengthen,” said NAHB Chief Economist Robert Dietz. “Job creation, low mortgage interest rates and pent-up demand will also spur growth in the single-family housing sector moving forward.”
...
Looking at the three-month moving averages for regional HMI scores, the South and Midwest both registered one-point gains to 59 and 58, respectively. The West remained unchanged at 67 and the Northeast fell three points to 41.
emphasis added
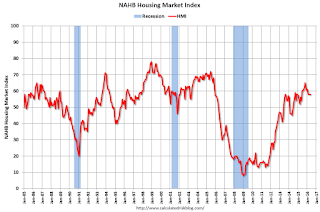 Click on graph for larger image.
This graph show the NAHB index since Jan 1985.
This was below the consensus forecast of 59, but still a strong reading.


