by Calculated Risk on 6/14/2016 08:38:00 AM
Tuesday, June 14, 2016
Retail Sales increased 0.5% in May
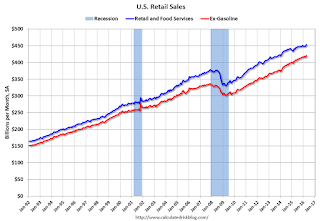
On a monthly basis, retail sales were up 0.5% from April to May (seasonally adjusted), and sales were up 2.5% from May 2015.
From the Census Bureau report:
The U.S. Census Bureau announced today that advance estimates of U.S. retail and food services sales for May, adjusted for seasonal variation and holiday and trading-day differences, but not for price changes, were $455.6 billion, an increase of 0.5 percent from the previous month, and 2.5 percent above May 2015. ... The March 2016 to April 2016 percent change was unrevised at up 1.3 percent (±0.2%).
 Click on graph for larger image.
This graph shows retail sales since 1992. This is monthly retail sales and food service, seasonally adjusted (total and ex-gasoline).
Retail sales ex-gasoline were up 0.3%.
The second graph shows the year-over-year change in retail sales and food service (ex-gasoline) since 1993.
 Retail and Food service sales ex-gasoline increased by 3.6% on a YoY basis.
The increase in May was above expectations for the month, and retail sales for March and April were revised up. A solid report.
Monday, June 13, 2016
Tuesday: Retail Sales, Small Business Survey
by Calculated Risk on 6/13/2016 10:53:00 PM
Tuesday:
• At 8:30 AM ET, Retail sales for May will be released. The consensus is for retail sales to increase 0.3% in May.
• At 9:00 AM ET,NFIB Small Business Optimism Index for May.
• At 10:00 AM ET, Manufacturing and Trade: Inventories and Sales (business inventories) report for April. The consensus is for a 0.2% increase in inventories.
From Matthew Graham at Mortgage News Daily: Yep, Mortgage Rates Are Still Super Low!
Mortgage rates haven't moved too much recently, and no one is complaining. While each of the past 5 days has only seen a modest drop in rates, they were already operating near 3-year lows. They officially hit new 3-year lows late last week, meaning today's modest improvement only takes us deeper into that territory.
...
It gets better. Three-year lows also happen to be pretty close to all-time lows. In terms of the average conventional 30yr fixed rate on a top tier scenario, we're talking about the difference between 3.5% today and 3.25% in late 2012. Those all-time lows were only available for a few weeks back then, and it was 3.375% that was the most commonly-quoted rate "all-time low" from there on out. So that's an eighth of a point between now and then--roughly $12/month on a $200k loan.
emphasis added
Update: Real Estate Agent Boom and Bust
by Calculated Risk on 6/13/2016 01:42:00 PM
Way back in 2005, I posted a graph of the Real Estate Agent Boom. Here is another update to the graph.
The graph shows the number of real estate licensees in California.
The number of agents peaked at the end of 2007 (housing activity peaked in 2005, and prices in 2006).
The number of salesperson's licenses is off 31.9% from the peak, and is starting to increase again (up 2.6% from low). The number of salesperson's licenses has fallen to May 2004 levels.
Brokers' licenses are off 11.8% from the peak and have only fallen to April 2006 levels, but are still slowly declining (down 1% year-over-year).

It appears we are starting to see a pickup in Real Estate licensees in California, although the number of Brokers is still declining.
Will the Rebound in Oil Prices Rescue the Houston Housing Market?
by Calculated Risk on 6/13/2016 10:56:00 AM
I don't have an answer right now, but I'll be watching inventory for clues.
The Houston Association of Realtors (HAR) hasn't released data for May yet.
However, in April, active listing were up 17% year-over-year compared to April 2015. The current level isn't unusually high for the Houston market (inventory was over 50,000 in 2010), but inventory has increased significantly since oil prices started falling.

This graph shows the number of active listings in Houston since January 2013.
Note: inventory in late 2014 was at historic lows in Houston - it is the trend that is concerning, not the current level.
If inventory stops increasing (year-over-year), then the housing market will probably be OK (and the rebound in oil prices would be a factor).
Right now it is too early to tell.
Sacramento Housing in May: Sales up 3.5%, Active Inventory down 18% YoY
by Calculated Risk on 6/13/2016 08:11:00 AM
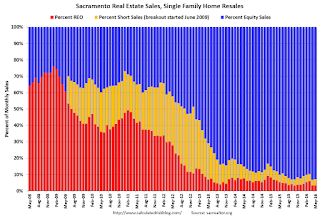
During the recession, I started following the Sacramento market to look for changes in the mix of houses sold (equity, REOs, and short sales). For a few years, not much changed. But in 2012 and 2013, we saw some significant changes with a dramatic shift from distressed sales to more normal equity sales.
This data suggests healing in the Sacramento market and other distressed markets are showing similar improvement. Note: The Sacramento Association of REALTORS® started breaking out REOs in May 2008, and short sales in June 2009.
In May, total sales were up 3.5% from May 2015, and conventional equity sales were up 4.9% compared to the same month last year.
In May, 7.0% of all resales were distressed sales. This was up from 6.5% last month, and down from 9.7% in May 2015.
The percentage of REOs was at 3.3% in May, and the percentage of short sales was 3.7%.
Here are the statistics.

This graph shows the percent of REO sales, short sales and conventional sales.
There has been a sharp increase in conventional (equity) sales that started in 2012 (blue) as the percentage of distressed sales declined sharply.
Active Listing Inventory for single family homes decreased 17.8% year-over-year (YoY) in May. This was the thirteenth consecutive monthly YoY decrease in inventory in Sacramento.
Cash buyers accounted for 14.7% of all sales (frequently investors).
Summary: This data suggests a more normal market with fewer distressed sales, more equity sales, and less investor buying - but limited inventory.
Sunday, June 12, 2016
Sunday Night Futures
by Calculated Risk on 6/12/2016 08:54:00 PM
From Tim Duy: Janet Yellen's Inflation Problem
Federal Reserve Chair Janet Yellen has been vexed by an inflation problem. Now she is also vexed by an inflation expectations problem. ...Weekend:
[M]y expectation is that the Fed does not change its inflation expectations language in this week's FOMC statement. If they do, they have to understand that they market participants will price out rate hikes until 2017. I don't think they want this; I think instead the Fed will be working to keep July in play (a tall order in my opinion).
• Schedule for Week of June 12, 2016
• FOMC Preview and Review of Projections
From CNBC: Pre-Market Data and Bloomberg futures: S&P are down 5 and DOW futures are down 20 (fair value).
Oil prices were mixed over the last week with WTI futures at $48.66 per barrel and Brent at $50.27 per barrel. A year ago, WTI was at $60, and Brent was at $63 - so prices are down almost 20% year-over-year.
Here is a graph from Gasbuddy.com for nationwide gasoline prices. Nationally prices are at $2.38 per gallon (down about $0.40 per gallon from a year ago).
FOMC Preview and Review of Projections
by Calculated Risk on 6/12/2016 10:15:00 AM
Almost all analysts are expecting no change in Fed policy at the March FOMC meeting this week. As an example, from Goldman Sachs economists Jan Hatzius and Zach Pandl:
"The May employment report was weak enough to raise questions about momentum in the labor market and the economy more broadly. At this point the natural reaction from policymakers will likely be to wait for more information and keep options open—and this should be the message from Chair Yellen in her press conference.Currently the Fed Funds target rate is the range of "1/4 to 1/2 percent". The current effective rate is 0.37 percent, close to the middle of the current range.
... With the unemployment rate at 4.7%, wage growth clearly picking up, and financial conditions much easier, there is likely a limit to how long the Fed’s pause can last.
The focus this month will be on the wording of the statement, any changes to the projections, and on the press conference.
Here are the March FOMC projections. Since the release of those projections, Q1 GDP was reported at a 0.8% annual rate.
Currently GDP is tracking around 2.5% annualized in Q2. The FOMC might revise down GDP for 2016 slightly.
| GDP projections of Federal Reserve Governors and Reserve Bank presidents | ||||
|---|---|---|---|---|
| Change in Real GDP1 | 2016 | 2017 | 2018 | |
| Mar 2016 | 2.1 to 2.3 | 2.0 to 2.3 | 1.8 to 2.1 | |
| Dec 2015 | 2.3 to 2.5 | 2.0 to 2.3 | 1.8 to 2.2 | |
The unemployment rate was at 4.7% in May, so the unemployment rate projection for Q4 2016 might be revised down.
| Unemployment projections of Federal Reserve Governors and Reserve Bank presidents | ||||
|---|---|---|---|---|
| Unemployment Rate2 | 2016 | 2017 | 2018 | |
| Mar 2016 | 4.6 to 4.8 | 4.5 to 4.7 | 4.5 to 5.0 | |
| Dec 2015 | 4.6 to 4.8 | 4.6 to 4.8 | 4.6 to 5.0 | |
As of April, PCE inflation was up only 1.1% from April 2015. With the recent increase in oil and gasoline prices, the range of PCE inflation projections might be narrowed, and the low end revised up for 2016.
| Inflation projections of Federal Reserve Governors and Reserve Bank presidents | ||||
|---|---|---|---|---|
| PCE Inflation1 | 2016 | 2017 | 2018 | |
| Mar 2016 | 1.0 to 1.6 | 1.7 to 2.0 | 1.9 to 2.0 | |
| Dec 2015 | 1.2 to 1.7 | 1.8 to 2.0 | 1.9 to 2.0 | |
PCE core inflation was up 1.6% in April year-over-year. It appears core PCE inflation might be revised up slightly for 2016.
| Core Inflation projections of Federal Reserve Governors and Reserve Bank presidents | ||||
|---|---|---|---|---|
| Core Inflation1 | 2016 | 2017 | 2018 | |
| Mar 2016 | 1.4 to 1.7 | 1.7 to 2.0 | 1.9 to 2.0 | |
| Dec 2015 | 1.5 to 1.7 | 1.7 to 2.0 | 1.9 to 2.0 | |
Overall, it appears these indicators are close to expectations. The FOMC will probably take no action at the meeting this week, and wait to see if employment picks up in June.
Saturday, June 11, 2016
Schedule for Week of June 12, 2016
by Calculated Risk on 6/11/2016 08:09:00 AM
The key economic reports this week are May Retail Sales on Tuesday, the Consumer Price Index (CPI) on Thursday, and May housing starts on Friday.
For manufacturing, May Industrial Production, and the June New York and Philly Fed manufacturing surveys will be released this week.
The FOMC meets on Tuesday and Wednesday, and no change to policy is expected at this meeting.
No economic releases are scheduled.
9:00 AM ET: NFIB Small Business Optimism Index for May.
 8:30 AM ET: Retail sales for May will be released. The consensus is for retail sales to increase 0.3% in May.
This graph shows retail sales since 1992 through April 2016. On a monthly basis, retail sales were up 1.3% from March to April (seasonally adjusted), and sales were up 3.0% from April 2015.
10:00 AM: Manufacturing and Trade: Inventories and Sales (business inventories) report for April. The consensus is for a 0.2% increase in inventories.
7:00 AM ET: The Mortgage Bankers Association (MBA) will release the results for the mortgage purchase applications index.
8:30 AM: The Producer Price Index for May from the BLS. The consensus is for a 0.3% increase in prices, and a 0.2% increase in core PPI.
8:30 AM: the New York Fed Empire State manufacturing survey for June. The consensus is for a reading of -3.5, up from -9.0.
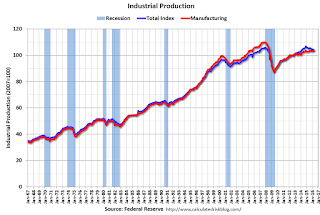
 9:15 AM: The Fed will release Industrial Production and Capacity Utilization for May.
This graph shows industrial production since 1967.
The consensus is for a 0.1% decrease in Industrial Production, and for Capacity Utilization to decrease to 75.2%.
2:00 PM: FOMC Meeting Announcement. No change to the Fed Funds rate is expected at this meeting.
2:00 PM: FOMC Forecasts This will include the Federal Open Market Committee (FOMC) participants' projections of the appropriate target federal funds rate along with the quarterly economic projections.
2:30 PM: Fed Chair Janet Yellen holds a press briefing following the FOMC announcement.
8:30 AM: The initial weekly unemployment claims report will be released. The consensus is for 270 thousand initial claims, up from 264 thousand the previous week.
8:30 AM: The Consumer Price Index for May from the BLS. The consensus is for a 0.3% increase in CPI, and a 0.2% increase in core CPI.
8:30 AM: the Philly Fed manufacturing survey for June. The consensus is for a reading of 2.0, up from -1.8.
10:00 AM: The June NAHB homebuilder survey. The consensus is for a reading of 59, up from 58 in May. Any number above 50 indicates that more builders view sales conditions as good than poor.
 8:30 AM: Housing Starts for May.
 Total housing starts increased to 1.172 million (SAAR) in April. Single family starts increased to 778 thousand SAAR in April.
The consensus for 1.160 million, down from the April rate.
10:00 AM: Regional and State Employment and Unemployment for May 2016
Friday, June 10, 2016
Hotels: Occupancy Rate Tracking just behind Record Year
by Calculated Risk on 6/10/2016 04:22:00 PM
On occupancy from HotelNewsNow.com: STR: US hotel results for week ending 4 June
The U.S. hotel industry reported mostly negative year-over-year results in the three key performance metrics during the week of 29 May through 4 June 2016, according to data from STR.The following graph shows the seasonal pattern for the hotel occupancy rate using the four week average.
Affected significantly by a Memorial Day calendar shift, the industry’s occupancy decreased 6.8% to 64.6%. Average daily rate was flat at US$118.45. Revenue per available room dropped 6.8% to US$76.56.
emphasis added
 The red line is for 2016, dashed orange is 2015, blue is the median, and black is for 2009 - the worst year since the Great Depression for hotels.
2015 was the best year on record for hotels.
So far 2016 is tracking just behind 2015, and well ahead of the median rate.
The occupancy rate should increase over the Summer travel period.
Data Source: Smith Travel Research, Courtesy of HotelNewsNow.com
Update: Framing Lumber Prices Up Year-over-year
by Calculated Risk on 6/10/2016 12:37:00 PM
Here is another update on framing lumber prices. Early in 2013 lumber prices came close to the housing bubble highs.
The price increases in early 2013 were due to a surge in demand (more housing starts) and supply constraints (framing lumber suppliers were working to bring more capacity online).
Prices didn't increase as much early in 2014 (more supply, smaller "surge" in demand).
In 2015, even with the pickup in U.S. housing starts, prices were down year-over-year. Note: Multifamily starts do not use as much lumber as single family starts, and there was a surge in multi-family starts. This decline in 2015 was also probably related to weakness in China.
Prices are now up year-over-year.

This graph shows two measures of lumber prices: 1) Framing Lumber from Random Lengths through May 2016 (via NAHB), and 2) CME framing futures.
Right now Random Lengths prices are up about 15% from a year ago, and CME futures are up about 20% year-over-year.


