 RSS Feed
 by Calculated Risk on 10/25/2016 11:55:00 AM
Tuesday, October 25, 2016
Real Prices and Price-to-Rent Ratio in August
Here is the earlier post on Case-Shiller: Case-Shiller: National House Price Index increased 5.3% year-over-year in August
The year-over-year increase in prices is mostly moving sideways now around 5%. In August, the index was up 5.3% YoY.
In the earlier post, I graphed nominal house prices, but it is also important to look at prices in real terms (inflation adjusted). Case-Shiller, CoreLogic and others report nominal house prices. As an example, if a house price was $200,000 in January 2000, the price would be close to $275,000 today adjusted for inflation (37%). That is why the second graph below is important - this shows "real" prices (adjusted for inflation).
It has been almost ten years since the bubble peak. In the Case-Shiller release this morning, the National Index was reported as being only 1.6% below the bubble peak (seasonally adjusted). However, in real terms, the National index is still about 16.2% below the bubble peak.
Nominal House Prices
 The first graph shows the monthly Case-Shiller National Index SA, the monthly Case-Shiller Composite 20 SA, and the CoreLogic House Price Indexes (through August) in nominal terms as reported.
In nominal terms, the Case-Shiller National index (SA) is back to December 2005 levels, and the Case-Shiller Composite 20 Index (SA) is back to June 2005 levels, and the CoreLogic index (NSA) is back to August 2005.
Real House Prices
 The second graph shows the same three indexes in real terms (adjusted for inflation using CPI less Shelter). Note: some people use other inflation measures to adjust for real prices.
CPI less Shelter has declined over the last two years pushing up real house prices.
In real terms, the National index is back to February 2004 levels, the Composite 20 index is back to October 2003, and the CoreLogic index back to January 2004.
In real terms, house prices are back to late 2003 / early 2004 levels.
Price-to-Rent
In October 2004, Fed economist John Krainer and researcher Chishen Wei wrote a Fed letter on price to rent ratios: House Prices and Fundamental Value. Kainer and Wei presented a price-to-rent ratio using the OFHEO house price index and the Owners' Equivalent Rent (OER) from the BLS.
 Here is a similar graph using the Case-Shiller National, Composite 20 and CoreLogic House Price Indexes.
This graph shows the price to rent ratio (January 1998 = 1.0).
On a price-to-rent basis, the Case-Shiller National index is back to August 2003 levels, the Composite 20 index is back to April 2003 levels, and the CoreLogic index is back to July 2003.
In real terms, and as a price-to-rent ratio, prices are back to late 2003 - and the price-to-rent ratio maybe moving a little more sideways now.
Case-Shiller: National House Price Index increased 5.3% year-over-year in August
by Calculated Risk on 10/25/2016 09:12:00 AM
S&P/Case-Shiller released the monthly Home Price Indices for August ("August" is a 3 month average of June, July and August prices).
This release includes prices for 20 individual cities, two composite indices (for 10 cities and 20 cities) and the monthly National index.
Note: Case-Shiller reports Not Seasonally Adjusted (NSA), I use the SA data for the graphs.
From S&P: Home Price Gains Continues in August According to the S&P CoreLogic Case-Shiller Indices
The S&P CoreLogic Case-Shiller U.S. National Home Price NSA Index, covering all nine U.S. census divisions, reported a 5.3% annual gain in August, up from 5.0% last month. The 10-City Composite posted a 4.3% annual increase, up from 4.1% the previous month. The 20-City Composite reported a year-over-year gain of 5.1%, up from 5.0% in July.
...
Before seasonal adjustment, the National Index posted a month-over-month gain of 0.5% in August. Both the 10-City Composite and the 20-City Composite posted a 0.4% increase in August. After seasonal adjustment, the National Index recorded a 0.6% month-over-month increase, and both the 10-City Composite and the 20-City Composite reported 0.2% month-over-month increases. After seasonal adjustment, 14 cities saw prices rise, two cities were unchanged, and four cities experienced negative monthly prices changes.
emphasis added
 Click on graph for larger image.
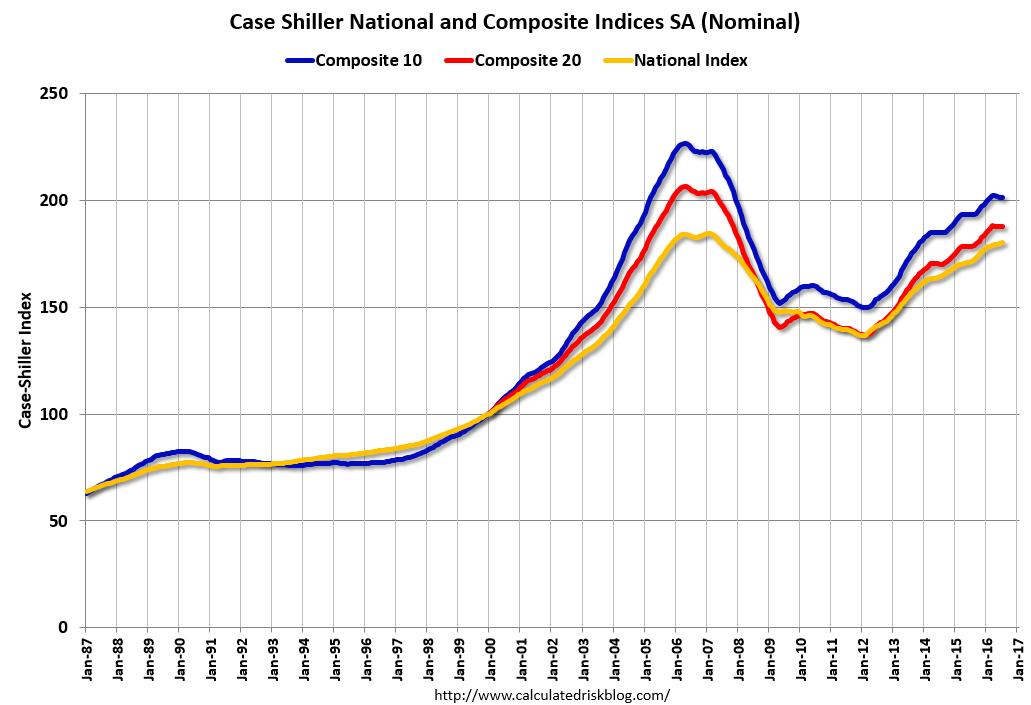
 The first graph shows the nominal seasonally adjusted Composite 10, Composite 20 and National indices (the Composite 20 was started in January 2000).
The Composite 10 index is off 10.9% from the peak, and up 0.2% in August (SA).
The Composite 20 index is off 8.9% from the peak, and up 0.2% (SA) in August.
The National index is off 1.6% from the peak (SA), and up 0.6% (SA) in August. The National index is up 33.0% from the post-bubble low set in December 2011 (SA).
 The second graph shows the Year over year change in all three indices.
The Composite 10 SA is up 4.3% compared to August 2015.
The Composite 20 SA is up 5.1% year-over-year.
The National index SA is up 5.3% year-over-year.
Note: According to the data, prices increased in 15 of 20 cities month-over-month seasonally adjusted.
I'll have more later.
Black Knight: Mortgage "Foreclosure Rate Falls to Nine-Year Low" in September
by Calculated Risk on 10/25/2016 07:01:00 AM
From Black Knight: Black Knight’s First Look at September Mortgage Data: Post-‘Brexit’ Prepay Activity Remains Strong; Foreclosure Rate Falls to Nine-Year Low
• Despite declining from August, September saw the third highest prepayment rate in three yearsAccording to Black Knight's First Look report for September, the percent of loans delinquent increased slightly in September compared to August, and declined 12.2% year-over-year.
• September’s less-than-one-percent seasonal increase in the delinquency rate was relatively mild by historical standards
• At one percent, the rate of all mortgages that are in active foreclosure fell to its lowest point in nine years
• Non-current mortgage rates continue to struggle in oil states, with Alaska and Wyoming seeing the largest increases over the past six months
The percent of loans in the foreclosure process declined 3.4% in September and were down 31.2% over the last year.
Black Knight reported the U.S. mortgage delinquency rate (loans 30 or more days past due, but not in foreclosure) was 4.27% in September, up from 4.24% in August.
The percent of loans in the foreclosure process declined in September to 1.00%.
The number of delinquent properties, but not in foreclosure, is down 292,000 properties year-over-year, and the number of properties in the foreclosure process is down 228,000 properties year-over-year.
Black Knight will release the complete mortgage monitor for September on November 7th.
| Black Knight: Percent Loans Delinquent and in Foreclosure Process | ||||
|---|---|---|---|---|
| Sept 2016 | Aug 2016 | Sept 2015 | Sept 2014 | |
| Delinquent | 4.27% | 4.24% | 4.87% | 5.66% |
| In Foreclosure | 1.00% | 1.04% | 1.46% | 1.89% |
| Number of properties: | ||||
| Number of properties that are delinquent, but not in foreclosure: | 2,165,000 | 2,151,000 | 2,457,000 | 2,849,000 |
| Number of properties in foreclosure pre-sale inventory: | 509,000 | 527,000 | 737,000 | 951,000 |
| Total Properties | 2,674,000 | 2,678,000 | 3,194,000 | 3,800,000 |
Monday, October 24, 2016
Lawler: Table of Distressed Sales and All Cash Sales for Selected Cities in September
by Calculated Risk on 10/24/2016 04:29:00 PM
Economist Tom Lawler sent me the table below of short sales, foreclosures and all cash sales for selected cities in September.
On distressed: Total "distressed" share is down year-over-year in most of these markets.
Short sales and foreclosures are down in most of these areas.
The All Cash Share (last two columns) is mostly declining year-over-year. As investors continue to pull back, the share of all cash buyers continues to decline.
| Short Sales Share | Foreclosure Sales Share | Total "Distressed" Share | All Cash Share | |||||
|---|---|---|---|---|---|---|---|---|
| Sep- 2016 | Sep- 2015 | Sep- 2016 | Sep- 2015 | Sep- 2016 | Sep- 2015 | Sep- 2016 | Sep- 2015 | |
| Las Vegas | 4.6% | 6.8% | 6.0% | 7.1% | 10.6% | 13.9% | 26.5% | 26.8% |
| Reno** | 3.0% | 3.0% | 2.0% | 3.0% | 5.0% | 6.0% | ||
| Phoenix | 1.7% | 2.4% | 2.0% | 3.5% | 3.7% | 5.9% | 20.2% | 23.1% |
| Sacramento | 1.4% | 2.9% | 3.1% | 4.1% | 4.5% | 6.9% | 16.3% | 17.6% |
| Minneapolis | 1.1% | 1.9% | 4.3% | 6.6% | 5.4% | 8.5% | 12.8% | 12.5% |
| Mid-Atlantic | 3.1% | 3.9% | 8.9% | 11.1% | 11.9% | 14.9% | 16.5% | 17.5% |
| Florida SF | 2.3% | 3.5% | 7.8% | 16.0% | 10.1% | 19.4% | 28.0% | 34.1% |
| Florida C/TH | 1.6% | 2.1% | 7.0% | 14.3% | 8.6% | 16.4% | 55.8% | 59.7% |
| Miami MSA SF | 3.3% | 5.1% | 9.4% | 18.6% | 12.7% | 23.7% | 28.5% | 33.2% |
| Miami MSA CTH | 2.7% | 2.7% | 9.5% | 18.0% | 12.1% | 20.7% | 58.1% | 63.0% |
| Chicago (city) | 12.1% | 17.5% | ||||||
| Spokane | 7.8% | 7.8% | ||||||
| Northeast Florida | 12.9% | 23.4% | ||||||
| Orlando | 31.3% | 35.5% | ||||||
| Toledo | 28.0% | 26.5% | ||||||
| Tucson | 22.2% | 25.9% | ||||||
| Peoria | 20.5% | 22.3% | ||||||
| Georgia*** | 20.8% | 22.3% | ||||||
| Omaha | 15.5% | 18.1% | ||||||
| Pensacola | 29.1% | 31.4% | ||||||
| Rhode Island | 11.1% | 9.0% | ||||||
| Richmond VA | 8.7% | 10.5% | 18.4% | 15.2% | ||||
| Memphis | 8.8% | 13.1% | ||||||
| Springfield IL** | 9.7% | 10.3% | ||||||
| *share of existing home sales, based on property records **Single Family Only ***GAMLS | ||||||||
DOT: Vehicle Miles Driven increased 3.4% year-over-year in August
by Calculated Risk on 10/24/2016 01:37:00 PM
The Department of Transportation (DOT) reported:
Travel on all roads and streets changed by 3.4% (9.3 billion vehicle miles) for August 2016 as compared with August 2015.The following graph shows the rolling 12 month total vehicle miles driven to remove the seasonal factors.
Travel for the month is estimated to be 284.9 billion vehicle miles.
The seasonally adjusted vehicle miles traveled for August 2016 is 268.6 billion miles, a 2.5% (6.5 billion vehicle miles) increase over August 2015. It also represents a 0.8% decrease (-2.2 billion vehicle miles) compared with July 2016.
The rolling 12 month total is moving up - mostly due to lower gasoline prices - after moving sideways for several years.
 Click on graph for larger image.
In the early '80s, miles driven (rolling 12 months) stayed below the previous peak for 39 months.
Miles driven (rolling 12) had been below the previous peak for 85 months - an all time record - before reaching a new high for miles driven in January 2015.
The second graph shows the year-over-year change from the same month in the previous year. Miles driven are up 3.4% year-over-year.
 In August 2016, gasoline averaged $2.28 per gallon according to the EIA. That was down from August 2015 when prices averaged $2.73 per gallon.
Gasoline prices aren't the only factor - demographics are also important. However, with lower gasoline prices, miles driven on a rolling 12 month basis, is setting a new high each month.
WSJ: "Retailers Rushed to Hire for Holidays"
by Calculated Risk on 10/24/2016 10:40:00 AM
From the Eric Morath at the WSJ: Retailers Rushed to Hire for Holidays, a Sign of Tight Labor Market
Retailers geared up to hire holiday-season workers in August this year, an unusually early start showing how competition has intensified for temporary help in a tight labor market.Typically retail companies start hiring for the holiday season in October, and really increase hiring in November. Here is a graph that shows the historical net retail jobs added for October, November and December by year.
Data from job-search site Indeed.com shows retailers, and the warehouse and logistics firms they compete with for seasonal labor, started searching for temporary workers a month earlier than in recent years. This suggests retailers and other firms “anticipate stronger consumer demand and expect that it will be harder to find the people they want to hire,” said Indeed economist Jed Kolko.
Last year, more than one in four retail workers hired in the fourth quarter of 2015 started their jobs in October, the highest share on records back to the 1930s.
 Click on graph for larger image.
This graph really shows the collapse in retail hiring in 2008. Since then seasonal hiring has increased back close to more normal levels.
Note that retailers have been hiring earlier with more seasonal hires in October (red).
Based on the information in the WSJ article, it appears seasonal hiring will be at record levels in October this year.
Chicago Fed "Economic Growth Picked Up in September"
by Calculated Risk on 10/24/2016 08:37:00 AM
From the Chicago Fed: Economic Growth Picked Up in September
Led by improvements in production-related indicators, the Chicago Fed National Activity Index (CFNAI) increased to –0.14 in September from –0.72 in August. All four broad categories of indicators that make up the index increased from August, but in September, all four categories made negative contributions to the index for the second straight month.This graph shows the Chicago Fed National Activity Index (three month moving average) since 1967.
The index’s three-month moving average, CFNAI-MA3, edged down to –0.21 in September from –0.14 in August. September’s CFNAI-MA3 suggests that growth in national economic activity was somewhat below its historical trend. The economic growth reflected in this level of the CFNAI-MA3 suggests subdued inflationary pressure from economic activity over the coming year
emphasis added
 Click on graph for larger image.
This suggests economic activity was below the historical trend in September (using the three-month average).
According to the Chicago Fed:
What is the National Activity Index? The index is a weighted average of 85 indicators of national economic activity drawn from four broad categories of data: 1) production and income; 2) employment, unemployment, and hours; 3) personal consumption and housing; and 4) sales, orders, and inventories.
A zero value for the index indicates that the national economy is expanding at its historical trend rate of growth; negative values indicate below-average growth; and positive values indicate above-average growth.
Sunday, October 23, 2016
Sunday Night Futures
by Calculated Risk on 10/23/2016 08:24:00 PM
Weekend:
• Schedule for Week of Oct 23, 2016
Monday:
• At 8:30 AM ET, the Chicago Fed National Activity Index for September. This is a composite index of other data.
From CNBC: Pre-Market Data and Bloomberg futures: S&P futures and DOW futures are up slightly (fair value).
Oil prices were mixed over the last week with WTI futures at $50.67 per barrel and Brent at $51.61 per barrel. A year ago, WTI was at $44, and Brent was at $47 - so oil prices are UP about 10% to 15% year-over-year.
Here is a graph from Gasbuddy.com for nationwide gasoline prices. Nationally prices are at $2.21 per gallon (close to unchanged from a year ago). Gasoline prices will be up year-over-year soon.
Vehicle Sales Forecasts: Sales Over 17 Million SAAR Again in October
by Calculated Risk on 10/23/2016 12:41:00 PM
The automakers will report October vehicle sales on Tuesday, November 1st.
Note: There were 26 selling days in October 2016, down from 28 in October 2015.
From WardsAuto: Forecast: October Daily Sales to Reach 15-Year High
A WardsAuto forecast calls for October U.S. light-vehicle sales to reach a 17.8 million-unit seasonally adjusted annual rate, making it the seventh month this year to surpass 17 million.From J.D. Power: New-Vehicle Retail Sales in October Slip; Sixth Monthly Decline of 2016
A 17.8 million SAAR is greatly higher than the 17.3 million recorded year-to-date through September, but does not beat the 18.1 million result recorded in the same month last year.
emphasis added
The SAAR for total sales is projected at 17.7 million units in October 2016, down from 18.1 million units a year ago.This graph shows light vehicle sales since the BEA started keeping data in 1967.
 The dashed line is the September sales rate.
Sales for 2016 - through the first nine months - were up slightly from the comparable period last year.
After increasing significantly for several years following the financial crisis, auto sales are now mostly moving sideways.
Saturday, October 22, 2016
Schedule for Week of Oct 23, 2016
by Calculated Risk on 10/22/2016 08:01:00 AM
The key economic reports this week are the advance estimate of Q3 GDP and September New Home Sales.
Also the Case-Shiller House Price Index for August will be released.
For manufacturing, the October Richmond and Kansas City Fed manufacturing surveys will be released this week.
8:30 AM ET: Chicago Fed National Activity Index for September. This is a composite index of other data.
9:00 AM: FHFA House Price Index for August 2016. This was originally a GSE only repeat sales, however there is also an expanded index. The consensus is for a 0.5% month-to-month increase for this index.
 9:00 AM ET: S&P/Case-Shiller House Price Index for August. Although this is the August report, it is really a 3 month average of June, July and August prices.
This graph shows the nominal seasonally adjusted National Index, Composite 10 and Composite 20 indexes through the July 2016 report (the Composite 20 was started in January 2000).
The consensus is for a 5.1% year-over-year increase in the Comp 20 index for August. The Zillow forecast is for the National Index to increase 5.2% year-over-year in August.
10:00 AM: Richmond Fed Survey of Manufacturing Activity for October.
7:00 AM ET: The Mortgage Bankers Association (MBA) will release the results for the mortgage purchase applications index.
 10:00 AM ET: New Home Sales for September from the Census Bureau.
 This graph shows New Home Sales since 1963. The dashed line is the August sales rate.
The consensus is for an decrease in sales to 600 thousand Seasonally Adjusted Annual Rate (SAAR) in September from 609 thousand in August.
8:30 AM ET: The initial weekly unemployment claims report will be released. The consensus is for 255 thousand initial claims, down from 260 thousand the previous week. Note: I expect some further impact on claims due to Hurricane Matthew.
8:30 AM: Durable Goods Orders for September from the Census Bureau. The consensus is for a 0.2% increase in durable goods orders.
10:00 AM: Pending Home Sales Index for September. The consensus is for a 1.0% increase in the index.
10:00 AM: the Q3 Housing Vacancies and Homeownership from the Census Bureau.
11:00 AM: Kansas City Fed Survey of Manufacturing Activity for October.
8:30 AM ET: Gross Domestic Product, 3rd quarter 2016 (Advance estimate). The consensus is that real GDP increased 2.5% annualized in Q3.
10:00 AM: University of Michigan's Consumer sentiment index (final for October). The consensus is for a reading of 88.5, up from the preliminary reading 87.9.


