by Calculated Risk on 11/14/2016 03:22:00 PM
Monday, November 14, 2016
Update: U.S. Heavy Truck Sales Slump Over?
The following graph shows heavy truck sales since 1967 using data from the BEA. The dashed line is the October 2016 seasonally adjusted annual sales rate (SAAR).
Heavy truck sales really collapsed during the recession, falling to a low of 181 thousand in April and May 2009, on a seasonally adjusted annual rate basis (SAAR). Then sales increased more than 2 1/2 times, and hit 479 thousand SAAR in June 2015.
Heavy truck sales have since declined again - probably mostly due to the weakness in the oil sector - and were at 374 thousand SAAR in October.
Even with the recent oil related decline, heavy truck sales are at about the average (and median) of the last 20 years.
Click on graph for larger image.
Sales have been at about the same level for four consecutive months. It is possible the oil related slump in heavy truck sales is over.
Mortgage Rates and Ten Year Yield, Expect 4% Mortgage Rates
by Calculated Risk on 11/14/2016 11:03:00 AM
Rates are rising with the expectation of much larger deficits next year (tax cuts combined with more spending).
With the ten year yield rising to 2.25% today, and based on an historical relationship, 30-year rates should currently be around 4.1%.
As of this morning, Mortgage News Daily reports that 30 year fixed rate mortgages are around 4%. Pretty close to expected.
The graph shows the relationship between the monthly 10 year Treasury Yield and 30 year mortgage rates from the Freddie Mac survey.

So expect mortgage rates to rise this week to around 4%.
Also, we should see a sharp drop in refinance activity.
Currently I don't think this increase in rates will have a significant impact on the housing market.
Update: Real Estate Agent Boom and Bust
by Calculated Risk on 11/14/2016 09:00:00 AM
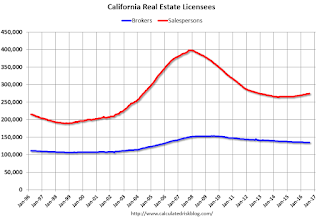
Way back in 2005, I posted a graph of the Real Estate Agent Boom. Here is another update to the graph.
The graph shows the number of real estate licensees in California.
The number of agents peaked at the end of 2007 (housing activity peaked in 2005, and prices in 2006).
The number of salesperson's licenses is off 31.1% from the peak, and is increasing again (up 3.9% from low). The number of salesperson's licenses has fallen to June 2004 levels.
Brokers' licenses are off 12.1% from the peak and have only fallen to March 2006 levels, but are still slowly declining (down 1% year-over-year).

It appears we are starting to see a pickup in Real Estate licensees in California, although the number of Brokers is still declining.
Sunday, November 13, 2016
Sunday Night Futures
by Calculated Risk on 11/13/2016 07:25:00 PM
Weekend:
• Schedule for Week of Nov 13, 2016
• Goldman: "Economic Implications of the Trump Agenda"
Monday:
• No major economic releases scheduled
From CNBC: Pre-Market Data and Bloomberg futures: S&P futures are up 7 and DOW futures are up 50 (fair value).
Oil prices were down over the last week with WTI futures at $43.56 per barrel and Brent at $44.94 per barrel. A year ago, WTI was at $41, and Brent was at $42 - so oil prices are up year-over-year.
Here is a graph from Gasbuddy.com for nationwide gasoline prices. Nationally prices are at $2.16 per gallon - a year ago prices were at $2.18 per gallon - so gasoline prices are mostly unchanged year-over-year.
Goldman: "Economic Implications of the Trump Agenda"
by Calculated Risk on 11/13/2016 10:19:00 AM
A few excerpts from an analysis piece by Goldman Sachs economists Sven Jari Stehn and Alec Phillips:
• President-elect Trump’s proposals, if enacted, would have significant implications for the US economic outlook over the next few years, some positive and some negative. The positive fiscal impulse from his tax reform and infrastructure proposals could provide a near-term boost to growth and, depending on the specifics, could have positive longer-run supply side effects.CR Note: No one knows exactly what Mr. Trump will propose. As an example, Trump has promised his supporters that he would not touch Social Security and Medicare, but House Speaker Paul Ryan has already suggested that cuts to Medicare are on the table. And note that Goldman does not "anticipate significant changes on immigration policy", yet that was Trump's initial campaign proposal. We have to wait and see what the exact proposals will be.
• However, other proposals could lead to new restrictions on foreign trade and immigration, which could have negative implications for growth, particularly over the longer term. ...
• We expect scaled-down versions of the tax reform and infrastructure policies to be enacted. We do not anticipate significant changes on immigration policy, but incremental restrictions seem likely. Mr. Trump’s monetary policy views are still unclear, but slightly more hawkish appointments appear likely at this stage. Trade policy is the greatest unknown, but we expect that Mr. Trump would follow through on at least some of the trade policies he has outlined.
• Keeping in mind that our simulations are subject to considerable uncertainty, we draw three main conclusions. First, Mr. Trump’s policies could boost growth in 2017 and 2018, but are likely to weigh on growth thereafter if trade and immigration restrictions are enacted, or if Fed policy turns more restrictive. Second, core inflation and the funds rate are likely to be higher for the next few years in almost all scenarios. Third, the risks around our base case appear asymmetric: a larger fiscal package could boost growth moderately more in the near term, but a more adverse policy mix would likely lead to a significant slowdown, higher inflation and tighter policy in subsequent years.
emphasis added
Saturday, November 12, 2016
Schedule for Week of Nov 13, 2016
by Calculated Risk on 11/12/2016 08:11:00 AM
The key economic reports this week are October Retail Sales, Housing Starts, and the Consumer Price Index (CPI).
For manufacturing, October industrial production, and the November New York, Philly and Kansas City Fed manufacturing surveys, will be released this week.
Fed Chair Janet Yellen will testify to Congress on Thursday on the economic outlook.
No economic releases scheduled.
 8:30 AM ET: Retail sales for October will be released. The consensus is for 0.6% increase in retail sales in October.
This graph shows retail sales since 1992 through September 2016.
8:30 AM ET: The New York Fed Empire State manufacturing survey for November. The consensus is for a reading of -2.3, up from -6.8.
10:00 AM: Manufacturing and Trade: Inventories and Sales (business inventories) report for September. The consensus is for a 0.2% increase in inventories.
7:00 AM ET: The Mortgage Bankers Association (MBA) will release the results for the mortgage purchase applications index.
8:30 AM: The Producer Price Index for October from the BLS. The consensus is for a 0.3% increase in prices, and a 0.2% increase in core PPI.
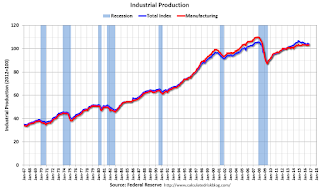
 9:15 AM: The Fed will release Industrial Production and Capacity Utilization for October.
This graph shows industrial production since 1967.
The consensus is for a 0.1% increase in Industrial Production, and for Capacity Utilization to be unchanged at 75.4%.
10:00 AM: The November NAHB homebuilder survey. The consensus is for a reading of 63, unchanged from 63 in October. Any number above 50 indicates that more builders view sales conditions as good than poor.
During the day: The AIA's Architecture Billings Index for October (a leading indicator for commercial real estate).
8:30 AM ET: The initial weekly unemployment claims report will be released. The consensus is for 257 thousand initial claims, up from 254 thousand the previous week.
8:30 AM: The Consumer Price Index for October from the BLS. The consensus is for 0.4% increase in CPI, and a 0.2% increase in core CPI.
 8:30 AM: Housing Starts for October.
 Total housing starts decreased to 1.047 million (SAAR) in September. Single family starts increased to 783 thousand SAAR in September.
The consensus is for 1.168 million, up from the September rate.
8:30 AM: the Philly Fed manufacturing survey for November. The consensus is for a reading of 8.0, down from 9.7.
10:00 AM, Testimony by Fed Chair Janet Yellen, The Economic Outlook, Before the Joint Economic Committee of Congress, U.S. Congress, Washington, D.C.
10:00 AM: Regional and State Employment and Unemployment (Monthly) for October 2016
11:00 AM: the Kansas City Fed manufacturing survey for November.
Friday, November 11, 2016
Hotels: Occupancy Rate on Track to be 2nd Best Year
by Calculated Risk on 11/11/2016 01:56:00 PM
Note: The year-over-year decline this week was related to timing of Halloween, but, in general, hotels are finishing the year strong. It is unlikely, but still possible that 2016 could be the best year ever for hotel occupancy. 2016 will be at least the 2nd best ever behind 2015.
From HotelNewsNow.com: STR: US hotel results for week ending 5 November
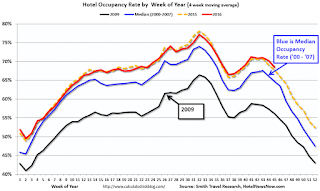
The U.S. hotel industry reported mixed results in the three key performance metrics during the week of 30 October through 5 November 2016, according to data from STR.The following graph shows the seasonal pattern for the hotel occupancy rate using the four week average.
In year-over-year comparisons, the industry’s occupancy fell 3.5% to 64.0%. Average daily rate (ADR) increased 1.6% to US$123.17. Revenue per available room (RevPAR) decreased 1.9% to US$78.82.
Opposite from last week, STR analysts cite a negative effect on results due to a Halloween calendar shift. The holiday was not included in the comparable week from 2015.
emphasis added
 The red line is for 2016, dashed orange is 2015, blue is the median, and black is for 2009 - the worst year since the Great Depression for hotels.
2015 was the best year on record for hotels.
So far 2016 is tracking just behind 2015, and well ahead of the median rate.
Year-to-date, the three best years are:
1) 2015: 67.6% average occupancy.
2) 2016: 67.5% average.
3) 2000: 66.9% average.
For hotels, the Fall business travel season is slowing down, and the occupancy rate will decline into the holiday season.
Data Source: STR, Courtesy of HotelNewsNow.com
Preliminary November Consumer Sentiment increases to 91.6
by Calculated Risk on 11/11/2016 10:50:00 AM
The preliminary University of Michigan consumer sentiment index for November was at 91.6, up from 87.2 in October.
The Sentiment Index in early November erased the small October decline to climb to its highest level since mid 2016 and rise slightly above the 2016 average of 91.1. The recent gain in sentiment was driven by an improved outlook for the economy. The most striking finding in early November was that both near and long-term inflation expectations jumped to 2.7% from last month's record matching lows of 2.4%. These increases must be replicated before they can be taken to indicate a troublesome development; thus far, the data has simply repeated the March 2016 peaks. Nonetheless, it may be viewed as added justification for next month's expected interest rate hike. The expected small increase in interest rates had little impact on favorable buying attitudes, and still supports a 2.5% increase in real consumer spending during 2017. Unfortunately, the November data must be accompanied by the proviso that it was collected before the result of the Presidential election was known late Tuesday.
emphasis added

Click on graph for larger image.
Update: Prime Working-Age Population Growing Again
by Calculated Risk on 11/11/2016 09:08:00 AM
The prime working age population peaked in 2007, and bottomed at the end of 2012. As of October 2016, there are still fewer people in the 25 to 54 age group than in 2007!
However the prime working age (25 to 54) will probably hit a new peak very soon.
An update: in 2014, I posted some demographic data for the U.S., see: Census Bureau: Largest 5-year Population Cohort is now the "20 to 24" Age Group, Decline in the Labor Force Participation Rate: Mostly Demographics and Long Term Trends, and The Future's so Bright ...
I pointed out that "even without the financial crisis we would have expected some slowdown in growth this decade (just based on demographics). The good news is that will change soon."
Changes in demographics are an important determinant of economic growth, and although most people focus on the aging of the "baby boomer" generation, the movement of younger cohorts into the prime working age is another key story. Here is a graph of the prime working age population (this is population, not the labor force) from 1948 through October 2016.

There was a huge surge in the prime working age population in the '70s, '80s and '90s.
The prime working age labor force grew even quicker than the population in the '70s and '80s due to the increase in participation of women. In fact, the prime working age labor force was increasing 3%+ per year in the '80s!
So when we compare economic growth to the '70s, '80, or 90's we have to remember this difference in demographics (the '60s saw solid economic growth as near-prime age groups increased sharply).
See: Demographics and GDP: 2% is the new 4%
The good news is the prime working age group has started to grow again, and is now growing at 0.5% per year - and this should boost economic activity. And it appears the prime working age group will exceed the previous peak later this year.
Note: If we expand the prime working age to 25 to 64, the story is a little different. The 55 to 64 age group is still expanding, but that will change in a few years - and that will slow growth in the 25 to 64 total age group.
Demographics are now improving in the U.S., and this is a reason for optimism.
Thursday, November 10, 2016
Off-topic: Acceptance and Response
by Calculated Risk on 11/10/2016 05:29:00 PM
I've spoken to several young adults today, and they are in shock and experiencing overwhelming grief about the election. How could this happen in America? And what can we do?
I've also spoken to older adults, and they are terrified by the echoes of history. We need to be on guard, but not borrow trouble (I doubt the worst fears will come to pass).
First, we have to accept that Mr. Trump will be the next President.
Second, we must make our voices heard and start preparing for the elections in two and four years. I expect to disagree with many of Trump's policy proposals, but I will keep an open mind. Maybe he will surprise us (I doubt it). I will write about the economic policies on this blog, but I care deeply about the non-economic issues too.
Third, we must make it clear what is not acceptable in a civil society.
No good person should EVER accept as normal the racism, bigotry, misogyny and xenophobia Mr. Trump and some of his supporters exhibited during the election. All good people must speak out every time we hear a disgusting comment. I'd hope Mr. Trump would speak out against the rash of verbal attacks we've seen over the last day on immigrants and non-white Americans. This must stop.
We should NEVER accept any attack on the 1st amendment. Being able to speak out is the people's check on abuse.
We should NEVER accept Mr. Trump abusing his power to silence or intimidate his critics, political opponents and accusers.
We should NEVER accept policies that disregard science and evidence.
Make your voice heard. And get ready for 2018.


