by Calculated Risk on 11/28/2016 01:34:00 PM
Monday, November 28, 2016
Hotels: Finishing Year Strong, Could be Best Year on Record
From HotelNewsNow.com: STR: US hotel results for week ending 19 November
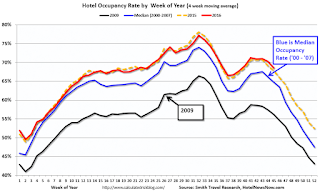
The U.S. hotel industry reported positive results in the three key performance metrics during the week of 13-19 November 2016, according to data from STR.The following graph shows the seasonal pattern for the hotel occupancy rate using the four week average.
In year-over-year comparisons, the industry’s occupancy rose 4.5% to 65.8%. Average daily rate (ADR) increased 4.6% to US$122.02. Revenue per available room (RevPAR) grew 9.2% to US$80.25.
emphasis added
 The red line is for 2016, dashed orange is 2015, blue is the median, and black is for 2009 - the worst year since the Great Depression for hotels.
2015 was the best year on record for hotels.
So far 2016 is tracking just behind 2015, and well ahead of the median rate. With a solid finish, 2016 could be the best year on record.
Year-to-date, the three best years are:
1) 2015: 67.4% average occupancy.
2) 2016: 67.4% average.
3) 2000: 66.5% average.
For hotels, the Fall business travel season is slowing down, and the occupancy rate will decline into the holiday season.
Data Source: STR, Courtesy of HotelNewsNow.com
Dallas Fed: Regional Manufacturing Activity "Continues to Expand" in November
by Calculated Risk on 11/28/2016 10:36:00 AM
Note: All regional Fed surveys indicated expansion in November. This is the first time all regional surveys were positive in two years (the decline in oil prices hit some regions hard - like Dallas).
From the Dallas Fed: Texas Manufacturing Activity Continues to Expand
Texas factory activity increased again in November, according to business executives responding to the Texas Manufacturing Outlook Survey. The production index, a key measure of state manufacturing conditions, posted a fifth consecutive positive reading and edged up to 8.8. ...This was the last of the regional Fed surveys for November.
...
The general business activity index shot up to 10.2 after nearly two years of negative readings.
...
Labor market measures indicated increased employment levels and longer workweeks. The employment index came in at 4.5 after a near-zero reading last month. Seventeen percent of firms noted net hiring, compared with 13 percent noting net layoffs. The hours worked index returned to positive territory in November, coming in at 2.5. ...
emphasis added
Here is a graph comparing the regional Fed surveys and the ISM manufacturing index:
 Click on graph for larger image.
The New York and Philly Fed surveys are averaged together (yellow, through November), and five Fed surveys are averaged (blue, through November) including New York, Philly, Richmond, Dallas and Kansas City. The Institute for Supply Management (ISM) PMI (red) is through October (right axis).
It seems likely the ISM manufacturing index will show expansion again in November, and the consensus is for a reading of 52.3.
Black Knight: House Price Index up 0.1% in September, Up 5.4% year-over-year
by Calculated Risk on 11/28/2016 08:53:00 AM
Note: I follow several house price indexes (Case-Shiller, CoreLogic, Black Knight, Zillow, FHFA, FNC and more). Note: Black Knight uses the current month closings only (not a three month average like Case-Shiller or a weighted average like CoreLogic), excludes short sales and REOs, and is not seasonally adjusted.
From Black Knight: Black Knight Home Price Index Report: September 2016 Transactions, U.S. Home Prices Up 0.1 Percent for the Month; Up 5.4 Percent Year-Over-Year
• September’s home price movement was relatively flat at the national level, with home prices ticking up just 0.1 percent from AugustThe year-over-year increase in this index has been about the same for the last year.
• U.S. home prices are up 5.4 percent from last year and are now within just 0.6 percent of hitting a new national peak
• Home prices in seven of the nation’s 20 largest states and seven of the 40 largest metros hit new peaks
Note that house prices are close to the bubble peak in nominal terms, but not in real terms (adjusted for inflation). Case-Shiller for September will be released tomorrow.
Sunday, November 27, 2016
Sunday Night Futures
by Calculated Risk on 11/27/2016 08:18:00 PM
The words of a President matter. Same with the words of a President-elect. Just like during the campaign, Donald Trump just keeps making stuff up ...
"In addition to winning the Electoral College in a landslide, I won the popular vote if you deduct the millions of people who voted illegally" Donald Trump, Nov 27, 2016There is no evidence of significant voter fraud. Sad. And dangerous. Trump is known to make up economic data too ... and that could have negative consequences for the economy and stock market.
Weekend:
• Schedule for Week of Nov 27, 2016
• November NFP Forecasts
Monday:
• At 10:30 AM ET, Dallas Fed Survey of Manufacturing Activity for November. This is the last of the regional Fed surveys for October.
From CNBC: Pre-Market Data and Bloomberg futures: S&P futures are down 5, and DOW futures are down 30 (fair value).
Oil prices were up over the last week with WTI futures at $45.39 per barrel and Brent at $46.52 per barrel. A year ago, WTI was at $41, and Brent was at $43 - so oil prices are up year-over-year.
Here is a graph from Gasbuddy.com for nationwide gasoline prices. Nationally prices are at $2.12 per gallon - a year ago prices were at $2.04 per gallon - so gasoline prices are up slightly year-over-year.
November NFP Forecasts
by Calculated Risk on 11/27/2016 11:01:00 AM
I hope everyone is having a great Thanksgiving weekend!
A couple of NFP forecasts ...
From Nomura:
[W]e forecast private payrolls grew by 155k in November with an additional 5k increase in government payrolls, implying that nonfarm payrolls grew by 160k. ... given another month of solid job gains, we think that the unemployment rate will tick down for a consecutive month and settle on a rounded basis at 4.8% in November. Lastly, on wage growth, we think some negative payback is in order as wage gains in October were amplified by inclement weather cutting short the workweek during the BLS survey reference period. Therefore, we forecast only a 0.1% m-o-m increase in average hourly earnings.From Merrill Lynch:
emphasis added
Recent labor market data has continued to show solid improvement. We expect the trend to continue in November with 170,000 in nonfarm payroll growth, a slight deceleration from the 176,000 average over the prior three months. We expect 165,000 in private payroll growth, with a modest 5,000 expansion in government payrolls.
We expect the labor force participation rate to remain at 62.8% and the unemployment rate to also remain unchanged at 4.9%. We expect a softer 0.2% mom gain in average hourly earnings after the strong 0.4% mom pop last month, leaving the year-over-year rate at 2.8%.
Saturday, November 26, 2016
November 2016: Unofficial Problem Bank list unchanged at 173 Institutions
by Calculated Risk on 11/26/2016 04:31:00 PM
This is an unofficial list of Problem Banks compiled only from public sources.
Here is the unofficial problem bank list for November 2016.
Changes and comments from surferdude808:
Update on the Unofficial Problem Bank List for November 2016. During the month, the list remained unchanged at 173 institutions after one removal and one addition.
However, assets increased by $5.0 billion to $59.9 billion. Updating to third quarter 2016 asset figures added $477 million to the asset total.
A year ago, the list held 255 institutions with assets of $77.0 billion. This is the first monthly increase in the asset total since $405 million during January 2015 and the largest increase since a $17.2 billion increase during April 2011. The FDIC terminated its enforcement actions against Noah Bank, Elkins Park, PA ($320 million) and issued a new action against First NBC Bank, New Orleans, LA ($4.9 billion).
Schedule for Week of Nov 27, 2016
by Calculated Risk on 11/26/2016 08:11:00 AM
The key report this week is the November employment report on Friday.
Other key indicators include October Personal Income and Outlays, November ISM manufacturing index, Case-Shiller house prices and November auto sales.
10:30 AM: Dallas Fed Survey of Manufacturing Activity for November. This is the last of the regional Fed surveys for October.
8:30 AM ET: Gross Domestic Product, 3rd quarter 2016 (Second estimate). The consensus is that real GDP increased 3.1% annualized in Q3, revised from 2.9% in the advance report.
 9:00 AM ET: S&P/Case-Shiller House Price Index for September. Although this is the September report, it is really a 3 month average of July, August and September prices.
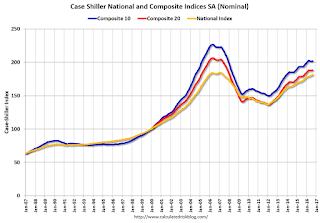
This graph shows the nominal seasonally adjusted National Index, Composite 10 and Composite 20 indexes through the August 2016 report (the Composite 20 was started in January 2000).
The consensus is for a 5.2% year-over-year increase in the Comp 20 index for September. The Zillow forecast is for the National Index to increase 5.4% year-over-year in September.
7:00 AM ET: The Mortgage Bankers Association (MBA) will release the results for the mortgage purchase applications index.
8:15 AM: The ADP Employment Report for November. This report is for private payrolls only (no government). The consensus is for 160,000 payroll jobs added in November, up from 147,000 added in October.
8:30 AM ET: Personal Income and Outlays for October. The consensus is for a 0.4% increase in personal income, and for a 0.5% increase in personal spending. And for the Core PCE price index to increase 0.1%.
9:45 AM: Chicago Purchasing Managers Index for November. The consensus is for a reading of 52.0, up from 50.6 in October.
10:00 AM: Pending Home Sales Index for October. The consensus is for a 0.8% increase in the index.
11:00 AM: The New York Fed will release their Q3 2016 Household Debt and Credit Report
2:00 PM: the Federal Reserve Beige Book, an informal review by the Federal Reserve Banks of current economic conditions in their Districts.
8:30 AM ET: The initial weekly unemployment claims report will be released. The consensus is for 253 thousand initial claims, up from 251 thousand the previous week.
 10:00 AM: ISM Manufacturing Index for November. The consensus is for the ISM to be at 52.3, up from 51.9 in October.
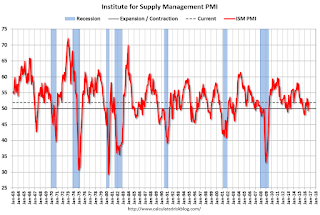
Here is a long term graph of the ISM manufacturing index.
The ISM manufacturing index indicated expansion at 51.9% in October. The employment index was at 52.9%, and the new orders index was at 52.1%.
10:00 AM: Construction Spending for October. The consensus is for a 0.6% increase in construction spending.
 All day: Light vehicle sales for November. The consensus is for light vehicle sales to decrease to 17.8 million SAAR in November, from 17.9 million in October (Seasonally Adjusted Annual Rate).
This graph shows light vehicle sales since the BEA started keeping data in 1967. The dashed line is the October sales rate.
8:30 AM: Employment Report for November. The consensus is for an increase of 170,000 non-farm payroll jobs added in November, up from the 161,000 non-farm payroll jobs added in October.
The consensus is for the unemployment rate to be unchanged at 4.9%.
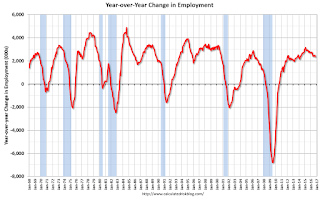
 This graph shows the year-over-year change in total non-farm employment since 1968.
In October, the year-over-year change was 2.36 million jobs.
A key will be the change in wages.
Friday, November 25, 2016
FHFA increases Conforming Loan Limits
by Calculated Risk on 11/25/2016 03:39:00 PM
This was announced Wednesday. From Jann Swanson at MortgageNewsDialy.com: FHFA Ups Conforming Loan Limit to $424,100
After leaving them in a holding pattern for 10 long years the Federal Housing Finance Agency (FHFA) has raised conforming loan limits for mortgages acquired by Fannie Mae and Freddie Mac. Separate loan limit announcements are expected shortly from FHA and the Veterans Administration.
The current loan limit, $417,000, has been in place since 2006. ... the agency has raised conforming loan limits by 1.7 percent to $424,100. The new loan limits are effective as of January 1, 2017.
FHFA designates as so-called high-cost areas, markets where 115 percent of the local median home value exceeds the baseline loan limit. HERA sets the maximum loan limit as a function of the area median home value with a ceiling on the limit of 150 percent of the baseline limit. Under this formula, the new limit for the highest cost areas will have a ceiling of $636,150 in 2017.
...
A list of the maximum conforming loan limits for all counties and county-equivalent areas can be found at 2017 Conforming Loan Limits
First Look: 2017 Housing Forecasts
by Calculated Risk on 11/25/2016 08:11:00 AM
Towards the end of each year I collect some housing forecasts for the following year. It looks like analysts are optimistic on New Home sales for 2017, although that might change with higher mortgage rates and policy changes. I'll post updates as the forecasts change (and add more forecasts soon).
First a review of the previous four years ...
Here is a summary of forecasts for 2016. In 2016, new home sales will probably be around 565 thousand, and total housing starts will be around 1.175 million. Fannie Mae and Merrill Lynch were very close on New Home sales, and MetroStudy was close on starts.
Here is a summary of forecasts for 2015. In 2015, new home sales were 501 thousand, and total housing starts were 1.112 million. Zillow, CoreLogic, and the MBA were right on with New Home sales, and CoreLogic, MetroStudy, MBA and Zillow were all correct on starts.
Here is a summary of forecasts for 2014. In 2014, new home sales were 437 thousand, and total housing starts were 1.003 million. No one was close on New Home sales (all way too optimistic), and Michelle Meyer (Merrill Lynch) and Fannie Mae were the closest on housing starts (about 10% too high). In 2014, many analysts underestimated the impact of higher mortgage rates and higher new home prices on new home sales and starts.
Here is a summary of forecasts for 2013. In 2013, new home sales were 429 thousand, and total housing starts were 925 thousand. Barclays was the closest on New Home sales followed by David Crowe (NAHB). Fannie Mae and the NAHB were the closest on housing starts.
The table below shows a few forecasts for 2017:
From Fannie Mae: Housing Forecast: November 2016
From NAHB: NAHB’s housing and economic forecast
From Wells Fargo: Monthly Economic Outlook
From NAR: U.S. Economic Outlook: November 2016
Note: For comparison, new home sales in 2016 will probably be around 565 thousand, and total housing starts around 1.175 million.
| Housing Forecasts for 2017 | ||||
|---|---|---|---|---|
| New Home Sales (000s) | Single Family Starts (000s) | Total Starts (000s) | House Prices1 | |
| Fannie Mae | 671 | 883 | 1,308 | 4.8%2 |
| Merrill Lynch | 1,225 | |||
| NAHB | 647 | 873 | 1,258 | |
| NAR | 623 | 838 | 1,221 | 4.2%3 |
| Wells Fargo | 1,180 | |||
| 1Case-Shiller unless indicated otherwise 2FHFA Purchase-Only Index 3NAR Median Prices | ||||
Thursday, November 24, 2016
Five Economic Reasons to be Thankful
by Calculated Risk on 11/24/2016 10:26:00 AM
With a Hat Tip to Neil Irwin (he started doing this a few years ago) ... here are five economic reasons to be thankful this Thanksgiving ...
1) Low unemployment claims.
The number of new claims for unemployment insurance benefits is at the lowest level in 40 years (with a much smaller population back then). The four week average of new unemployment has fallen to 251,000, down from 297,000 a year ago, and down from the peak of 660,000 during the great recession.

Here is a graph of initial weekly unemployment claims.
The dashed line on the graph is the current 4-week average. The four-week average of weekly unemployment claims decreased to 251,000.
The low level of claims suggests relatively few layoffs.
2) Job Openings Near Record Levels.
There were 5.5 million job openings in September. This is close to the record high of 5.8 million in April 2016.

Job openings (yellow) have been above 5 million for 20 consecutive months.
Note that Quits are up 12% year-over-year. These are voluntary separations. (see light blue columns at bottom of graph for trend for "quits").
More job openings, and rising quits, are positive signs for the labor market.
3) Household Debt burdens are near record lows.
Household debt burdens have declined sharply over the last several years.
The Household debt service ratio was at 13.2% in 2007, and has fallen to under 10% now.

The overall Debt Service Ratio increased slightly in Q2 2016, and has been moving sideways and is near a record low. Note: The financial obligation ratio (FOR) was unchanged in Q2 and is also near a record low (not shown).
The DSR for mortgages (blue) are near the low for the last 35 years. This ratio increased rapidly during the housing bubble, and continued to increase until 2007. With falling interest rates, and less mortgage debt (mostly due to foreclosures), the mortgage ratio has declined significantly.
This data suggests aggregate household cash flow has improved.
4) Gasoline prices are near the lows since the Great Recession.

Here is a 10 year graph from Gasbuddy.com for nationwide gasoline prices.
Gasoline prices are around $2.12 per gallon, slightly higher than last year at Thanksgiving, and near the lowest since the Great Recession.
5) Wages growth is picking up.

The graph shows the nominal year-over-year change in "Average Hourly Earnings" for all private employees. Nominal wage growth was at 2.8% YoY in October. This series is noisy, however overall wage growth is trending up - especially over the last year and a half.
There is much more positive economic news - solid auto sales, housing starts increasing, U-3 unemployment rate below 5%, and U-6 rate falling, the recent pickup in GDP - and much more.
There are still problems - not everyone has participated in the current expansion, wealth and income inequality are record extremes, there is too much student debt, and climate change is posing a real threat to the economy in the future - but there are many economic reasons to be thankful this Thanksgiving.
Happy Thanksgiving to All!


