by Calculated Risk on 3/13/2017 08:23:00 PM
Monday, March 13, 2017
"Mortgage Rates Approach 3-Year Highs Ahead of Fed"
From Matthew Graham at Mortgage News Daily: Mortgage Rates Approach 3-Year Highs Ahead of Fed
Mortgage rates rose for the 10th time in the past 11 days today, bringing them very close to highest levels in 3 years. You'd have to go back to April 30th, 2014 to see the average lender offering higher rates. The most common conventional 30yr fixed quote is easily up to 4.375% on top tier scenarios with a growing number of lenders moving up to 4.5%.Tuesday:
emphasis added
• At 6:00 AM ET, NFIB Small Business Optimism Index for February.
• At 8:30 AM, The Producer Price Index for February from the BLS. The consensus is for 0.1% increase in PPI, and a 0.2% increase in core PPI.
Update: Framing Lumber Prices Up Year-over-year
by Calculated Risk on 3/13/2017 05:20:00 PM
Here is another update on framing lumber prices. Early in 2013 lumber prices came close to the housing bubble highs.
The price increases in early 2013 were due to a surge in demand (more housing starts) and supply constraints (framing lumber suppliers were working to bring more capacity online).
Prices didn't increase as much early in 2014 (more supply, smaller "surge" in demand).
In 2015, even with the pickup in U.S. housing starts, prices were down year-over-year. Note: Multifamily starts do not use as much lumber as single family starts, and there was a surge in multi-family starts. This decline in 2015 was also probably related to weakness in China.
Prices in 2017 are up year-over-year.

This graph shows two measures of lumber prices: 1) Framing Lumber from Random Lengths through early March 2017 (via NAHB), and 2) CME framing futures.
Right now Random Lengths prices are up 26% from a year ago, and CME futures are up about 33% year-over-year.
Long Beach: Port Traffic down in February due to Chinese New Year
by Calculated Risk on 3/13/2017 03:01:00 PM
Note: I mentioned earlier that the timing of the Chinese New Year increased the trade deficit with China in January. In February, the deficit with China will likely decline.
From the Port of Long Beach: Cargo Declines During Lunar New Year
Reduced economic activity in Asia associated with the Lunar New Year contributed to lower February container volumes at the Port of Long Beach.
Overall, traffic totaled 498,311 twenty-foot equivalent units (TEUs), a decline of 11.2 percent compared to the same month last year, the highest-volume February in Port history. Cargo in February 2016 ballooned 35.9 percent year-over-year.
The Lunar New Year holiday began Jan. 28, almost two weeks earlier than in 2016. The Lunar New Year typically results in slower trade since businesses in China — the world’s No. 2 economy and the Port’s primary trading partner — close for a week or more to observe the holiday. The impact on the Port is seen two weeks afterwards, accounting for the time it takes vessels to cross the Pacific.
February Retail Sales and Tax Refunds
by Calculated Risk on 3/13/2017 12:22:00 PM
I've mentioned this before ... although the consensus is for a 0.2% increase in retail sales in February (to be released on Wednesday), it seems likely retail sales will disappoint due to delayed tax refunds.
An excerpt from a Merrill Lynch note this morning:
Based on the aggregated BAC credit and debit card data, retail sales ex-autos declined 0.2% mom seasonally adjusted in February. ... We think there is a specific reason for the contraction in sales in February: tax refunds were delayed. This is due to a change in tax law which calls for the IRS to wait until February 15th to issue refunds to taxpayers who claimed the earned-income tax credit (EITC) or the additional child tax credit (ACTC). Although refunds nearly caught up at the very end of the month with a spike on February 23, the lack of refunds earlier in the month likely weighed on sales.
BLS: Unemployment Rates Stable in 45 states in January, Arkansas and Oregon at New Lows
by Calculated Risk on 3/13/2017 10:28:00 AM
Update: First graph corrected.
From the BLS: Regional and State Employment and Unemployment Summary
Unemployment rates were significantly lower in January in 5 states and stable in 45 states and the District of Columbia, the U.S. Bureau of Labor Statistics reported today. Six states had notable jobless rate decreases from a year earlier and 44 states and the District had no significant change. The national unemployment rate was 4.8 percent in January, little changed from that of both December 2016 and January 2016.
...
New Hampshire had the lowest unemployment rate in January, 2.7 percent, closely followed by Hawaii, 2.8 percent, and Colorado and South Dakota, 2.9 percent each. The rates in both Arkansas (3.8 percent) and Oregon (4.3 percent) set new series lows. ... New Mexico had the highest jobless rate, 6.7 percent, followed by Alaska and Alabama, 6.5 percent and 6.4 percent, respectively.
emphasis added
 Click on graph for larger image.
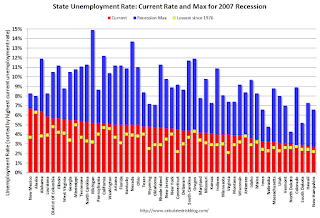
This graph shows the current unemployment rate for each state (red), and the max during the recession (blue). All states are well below the maximum unemployment rate for the recession.
The size of the blue bar indicates the amount of improvement. The yellow squares are the lowest unemployment rate per state since 1976.
The states are ranked by the highest current unemployment rate. New Mexico, at 6.7%, had the highest state unemployment rate.
 The second graph shows the number of states (and D.C.) with unemployment rates at or above certain levels since January 2006. At the worst of the employment recession, there were 11 states with an unemployment rate at or above 11% (red).
Currently no state has an unemployment rate at or above 7% (light blue); Only three states are at or above 6% (dark blue). The states are New Mexico (6.7%), Alaska (6.5%), and Alabama (6.4%).
Sunday, March 12, 2017
Sunday Night Futures
by Calculated Risk on 3/12/2017 07:46:00 PM
Weekend:
• Schedule for Week of Mar 12, 2017
• Review of FOMC Projections
From CNBC: Pre-Market Data and Bloomberg futures: S&P futures are down 3, and DOW futures are down 22 (fair value).
Oil prices were down about 10% over the last week with WTI futures at $48.01 per barrel and Brent at $50.90 per barrel. A year ago, WTI was at $36, and Brent was at $38 - so oil prices are up about 33% year-over-year.
Here is a graph from Gasbuddy.com for nationwide gasoline prices. Nationally prices are at $2.29 per gallon - a year ago prices were at $1.93 per gallon - so gasoline prices are up about 35 cents a gallon year-over-year.
Review of FOMC Projections
by Calculated Risk on 3/12/2017 01:37:00 PM
The consensus is that the Fed will raise the Fed Funds Rate 25 bps following the FOMC meeting this coming week.
Since a rate hike is expected (and assuming it happens), the focus this month will be on the wording of the statement, the projections, and Fed Chair Janet Yellen's press conference.
Here are the December FOMC projections. In general, the data has surprised somewhat to the upside since the December FOMC projections were released.
Projections for GDP in 2017 and 2018 might be revised up slightly. My guess is, as far as the impact of fiscal stimulus, the Fed will wait and see what the actual proposals will be.
| GDP projections of Federal Reserve Governors and Reserve Bank presidents | |||
|---|---|---|---|
| Change in Real GDP1 | 2017 | 2018 | 2019 |
| Dec 2016 | 1.9 to 2.3 | 1.8 to 2.2 | 1.8 to 2.0 |
| Sept 2016 | 1.9 to 2.2 | 1.9 to 2.2 | 1.7 to 2.0 |
The unemployment rate was at 4.7% in February. So the unemployment rate for Q4 2017 might be revised down slightly.
| Unemployment projections of Federal Reserve Governors and Reserve Bank presidents | |||
|---|---|---|---|
| Unemployment Rate2 | 2017 | 2018 | 2019 |
| Dec 2016 | 4.5 to 4.6 | 4.3 to 4.7 | 4.3 to 4.8 |
| Sept 2016 | 4.5 to 4.7 | 4.4 to 4.7 | 4.4 to 4.8 |
As of January, PCE inflation was up 1.9% from January 2016. It appears inflation might be revised up slightly for 2017.
| Inflation projections of Federal Reserve Governors and Reserve Bank presidents | |||
|---|---|---|---|
| PCE Inflation1 | 2017 | 2018 | 2019 |
| Dec 2016 | 1.7 to 2.0 | 1.9 to 2.0 | 2.0 to 2.1 |
| Sept 2016 | 1.7 to 1.9 | 1.8 to 2.0 | 1.9 to 2.0 |
PCE core inflation was up 1.7% in January year-over-year. Core PCE inflation might be revised up slightly for 2017.
| Core Inflation projections of Federal Reserve Governors and Reserve Bank presidents | |||
|---|---|---|---|
| Core Inflation1 | 2017 | 2018 | 2019 |
| Dec 2016 | 1.8 to 1.9 | 1.9 to 2.0 | 2.0 |
| Sept 2016 | 1.7 to 1.9 | 1.9 to 2.0 | 2.0 |
In general, it appears GDP and inflation might be revised up slightly, and the unemployment rate revised slightly lower.
Saturday, March 11, 2017
Goldman: FOMC Preview
by Calculated Risk on 3/11/2017 02:58:00 PM
A few excerpts from a note by Goldman Sachs economists Zach Pandl and Jan Hatzius:
A rate increase at the March FOMC meeting now looks like a forgone conclusion ...CR Note: Just about everyone expects a rate hike at the FOMC meeting this week.
First, financial conditions have eased substantially. ... Second, incoming activity data continue to surprise on the upside.
...
We expect the FOMC to make a few changes ... including indicating that risks to the economic outlook are “balanced”, and signaling that the 2% inflation objective will likely be reached before too long. In the Summary of Economic Projections (SEP) we look for slight upgrades to GDP growth and core inflation ...
emphasis added
Schedule for Week of Mar 12, 2017
by Calculated Risk on 3/11/2017 08:11:00 AM
The key economic reports this week are Retail Sales, Housing Starts, and the Consumer Price Index (CPI).
For manufacturing, February industrial production, and the March New York, and Philly Fed manufacturing surveys, will be released this week.
The FOMC meets on Tuesday and Wednesday, and the FOMC is expected to raise rates at this meeting.
10:00 AM ET: The Fed will release the monthly Labor Market Conditions Index (LMCI).
10:00 AM: Regional and State Employment and Unemployment (Monthly) for January 2017
6:00 AM ET: NFIB Small Business Optimism Index for February.
8:30 AM: The Producer Price Index for February from the BLS. The consensus is for 0.1% increase in PPI, and a 0.2% increase in core PPI.
7:00 AM ET: The Mortgage Bankers Association (MBA) will release the results for the mortgage purchase applications index.
 8:30 AM ET: Retail sales for February will be released. The consensus is for 0.2% increase in retail sales in February.
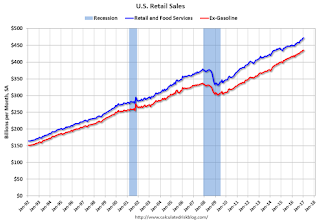
This graph shows retail sales since 1992 through January 2017.
8:30 AM: The Consumer Price Index for February from the BLS. The consensus is for 0.1% increase in CPI, and a 0.2% increase in core CPI.
8:30 AM ET: The New York Fed Empire State manufacturing survey for March. The consensus is for a reading of 15.7, down from 18.7.
10:00 AM: The March NAHB homebuilder survey. The consensus is for a reading of 66, up from 65 in February. Any number above 50 indicates that more builders view sales conditions as good than poor.
10:00 AM: Manufacturing and Trade: Inventories and Sales (business inventories) report for January. The consensus is for a 0.3% increase in inventories.
2:00 PM: FOMC Meeting Announcement. The FOMC is expected to increase the Fed Funds rate 25 bps at this meeting.
2:00 PM: FOMC Forecasts This will include the Federal Open Market Committee (FOMC) participants' projections of the appropriate target federal funds rate along with the quarterly economic projections.
2:30 PM: Fed Chair Janet Yellen holds a press briefing following the FOMC announcement.
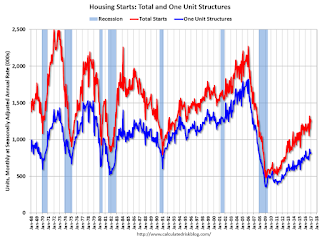
 8:30 AM: Housing Starts for February.
 The consensus is for 1.266 million, up from the January rate of 1.246 million.
8:30 AM ET: The initial weekly unemployment claims report will be released. The consensus is for 242 thousand initial claims, down from 243 thousand the previous week.
8:30 AM: the Philly Fed manufacturing survey for March. The consensus is for a reading of 32.5, down from 43.3.
 10:00 AM: Job Openings and Labor Turnover Survey for January from the BLS.
 This graph shows job openings (yellow line), hires (purple), Layoff, Discharges and other (red column), and Quits (light blue column) from the JOLTS.
Jobs openings were mostly unchanged in December at 5.501 million compared to 5.505 million in November.
The number of job openings (yellow) were up 4% year-over-year, and Quits were down 3% year-over-year.
 9:15 AM: The Fed will release Industrial Production and Capacity Utilization for February.
This graph shows industrial production since 1967.
The consensus is for a 0.2% increase in Industrial Production, and for Capacity Utilization to increase to 75.4%.
10:00 AM: University of Michigan's Consumer sentiment index (preliminary for March). The consensus is for a reading of 97.0, up from 96.3 in February.
Friday, March 10, 2017
Merrill on the March FOMC Meeting
by Calculated Risk on 3/10/2017 06:48:00 PM
A few excerpts from a research note from Merrill Lynch:
The markets listened to the chorus of Fed officials and are now pricing in near certainty of a hike. With the rate decision on 15 March likely to be a non-event, attention turns to the Summary of Economic Projections and the press conference. We believe the combination of a shift higher in the dots and language changes in the statement will send a hawkish signal. However, we suspect that Chair Yellen will sound more balanced in her press conference.
We expect a number of tweaks to the statement which will deliver a more hawkish message. In the first paragraph, we think the Fed will present a more positive assessment of the economy. We also think that the Fed will change the economic outlook paragraph to argue that the balance of risks has improved. ...
We think Chair Yellen's press conference will be less hawkish than the statement or SEP. ... Chair Yellen is likely to sound more positive about the outlook, noting the improvement in sentiment measures and reduction in labor market slack. However, we expect her to argue that inflation should only increase slowly to the target. Also, she is likely to argue that the Fed is not behind the curve and isn't “playing catch up” with policy. We also look for Yellen to note that the committee is discussing the plan for addressing the balance sheet and that more formal communication will be forthcoming. In the meantime, she is likely to note that the Fed will continue with the reinvestment program until an increase in fed funds rates is “well underway”.
emphasis added


