by Calculated Risk on 5/17/2017 01:45:00 PM
Wednesday, May 17, 2017
Lawler: Early Read on Existing Home Sales in April
From housing economist Tom Lawler:
Based on publicly available state and local realtor/MLS reports released through today, I project that US existing home sales as estimated by the National Association of Realtors ran at a seasonally adjusted annual rate of 5.56 million in April, down 2.6% from March’s preliminary pace and up 1.5% from last April’s seasonally adjusted pace. Unadjusted sales as estimated by the NAR last month should be about 2.8% LOWER than last April’s pace, with the “adjusted/unadjusted” YOY growth difference reflecting this April’s lower business day count, as well as the different timing of Easter (April 16 this year vs. March 27 last year.)
On the inventory front, local realtor/MLS data suggest that the monthly increase in the number of homes for sale last month was slightly higher than last April’s increase, and I project that the NAR’s estimate of the existing home inventory for April will be 2.00 million, up 9.3% from March and down 5.7% from last April.
Finally, realtor/MLS suggest that the NAR’s estimate of the median existing single-family home sales price for April will be up about 7.0% from last April.
Areas that experienced a double-digit decline in YOY home sales included, but were not limited to, Portland (Oregon), Minneapolis, DC (city), San Francisco Bay Area, Boston, New Hampshire, South Central Wisconsin (includes Dane County), Spokane, Peoria, Springfield (Illinois), Louisville, and Grand Rapids.
emphasis added
CR Note: The NAR is scheduled to release existing home sales for April next Wednesday, May 24th. The early consensus is for sales of 5.71 million SAAR (take the under).
NY Fed: "Household Debt Surpasses its Peak Reached During the Recession in 2008"
by Calculated Risk on 5/17/2017 11:13:00 AM
The Q1 report was released today: Household Debt and Credit Report.
From the NY Fed: Household Debt Surpasses its Peak Reached During the Recession in 2008
The Federal Reserve Bank of New York today issued its Quarterly Report on Household Debt and Credit, which reported that total household debt reached $12.73 trillion in the first quarter of 2017 and finally surpassed its $12.68 trillion peak reached during the recession in 2008. This marked a $149 billion (1.2%) quarterly increase and nearly three years of continued growth since the long period of deleveraging following the Great Recession.
...
“Almost nine years later, household debt has finally exceeded its 2008 peak but the debt and its borrowers look quite different today. This record debt level is neither a reason to celebrate nor a cause for alarm. But it does provide an opportune moment to consider debt performance,” said Donghoon Lee, Research Officer at the New York Fed. “While most delinquency flows have improved markedly since the Great Recession and remain low overall, there are divergent trends among debt types. Auto loan and credit card delinquency flows are now trending upwards, and those for student loans remain stubbornly high.”
Mortgage balances increased again while originations declined and median credit scores of borrowers for new mortgages increased, reflecting tightening underwriting.
Mortgage delinquencies worsened slightly and foreclosure notations increased but remained low by historical standards.
...
Bankruptcy notations reached another low the 18-year history of this series.
This quarter saw a notable uptick in credit card debt transitioning into delinquencies, a continued upward trend of auto loans transitioning into serious delinquencies, and student loan transitions into serious delinquencies remaining high.
emphasis added
 Click on graph for larger image.
Here are two graphs from the report:
The first graph shows aggregate consumer debt increased in Q1. Household debt previously peaked in 2008, and bottomed in Q2 2013.
Mortgage debt increased in Q1, from the NY Fed:
Mortgage balances, the largest component of household debt, increased again during the first quarter. Mortgage balances shown on consumer credit reports on March 31 stood at $8.63 trillion, an increase of $147 billion from the fourth quarter of 2016. Balances on home equity lines of credit (HELOC) declined by $17 billion and now stand at $456 billion. Non-housing balances were mixed in the first quarter. Auto loans and student loan balances grew, by $10 billion and $34 billion respectively, while credit card balances declined by $15 billion.
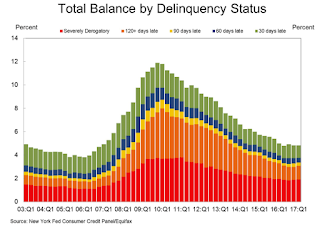 The second graph shows the percent of debt in delinquency. There is still a larger than normal percent of debt 90+ days delinquent (Yellow, orange and red).
The overall delinquency rate was mostly unchanged in Q1. From the NY Fed:
Aggregate delinquency rates were roughly flat in the first quarter of 2017, with some variation across product types. As of March 31, 4.8% of outstanding debt was in some stage of delinquency. Of the $615 billion of debt that is delinquent, $426 billion is seriously delinquent (at least 90 days late or “severely derogatory”).
MBA: "Mortgage Applications Decrease in Latest Weekly Survey"
by Calculated Risk on 5/17/2017 07:00:00 AM
From the MBA: Mortgage Applications Decrease in Latest MBA Weekly Survey
Mortgage applications decreased 4.1 percent from one week earlier, according to data from the Mortgage Bankers Association’s (MBA) Weekly Mortgage Applications Survey for the week ending May 12, 2017.
... The Refinance Index decreased 6 percent from the previous week. The seasonally adjusted Purchase Index decreased 3 percent from one week earlier. The unadjusted Purchase Index decreased 3 percent compared with the previous week and was 9 percent higher than the same week one year ago. ...
The average contract interest rate for 30-year fixed-rate mortgages with conforming loan balances ($424,100 or less) remained unchanged at 4.23 percent, with points increasing to 0.37 from 0.31 (including the origination fee) for 80 percent loan-to-value ratio (LTV) loans.
emphasis added
 Click on graph for larger image.
The first graph shows the refinance index since 1990.
Refinance activity remains low - and will not increase significantly unless rates fall sharply.
 The second graph shows the MBA mortgage purchase index.
 Even with the increase in mortgage rates late last year, purchase activity is still up 9% year-over-year.
Tuesday, May 16, 2017
Wednesday: Q1 2017 Household Debt and Credit Report
by Calculated Risk on 5/16/2017 07:38:00 PM
From Matthew Graham at Mortgage News Daily: Mortgage Rates Back at 2-Week Lows
Compared to yesterday, mortgage rates are either a little bit higher or lower depending on the lender at the moment. On average, they've inched just past last Friday's levels, meaning they're the lowest in 2 weeks.Thursday:
As nice as that sounds, it's worth noting that we're really splitting hairs here. Most anyone pricing out a mortgage right now won't see any difference in their rate quote over the past few days. The biggest drop occurred last Friday and we haven't seen appreciable movement since then. Most lenders continue to quote conventional 30yr fixed rates in a range of 4.0-4.25% for top tier scenarios, with 4.125% being the most prevalent.br /> emphasis added
• At 7:00 AM ET, The Mortgage Bankers Association (MBA) will release the results for the mortgage purchase applications index.
• At 11:00 AM, The New York Fed will release their Q1 2017 Household Debt and Credit Report
Comments on April Housing Starts
by Calculated Risk on 5/16/2017 02:12:00 PM
Earlier: Housing Starts decreased to 1.172 Million Annual Rate in April
The housing starts report released this morning showed starts were down in April compared to March, and were up 0.7% year-over-year compared to April 2016.
Note that multi-family is frequently volatile month-to-month, and has seen especially wild swings over the last year.
This first graph shows the month to month comparison between 2016 (blue) and 2017 (red).

Starts were up 0.7% in April 2017 compared to April 2016, and starts are up 5.3% year-to-date.
Note that single family starts are up 7.0% year-to-date, and the weakness (as expected) has been in multi-family starts.
My guess is starts will increase around 3% to 7% in 2017.
Below is an update to the graph comparing multi-family starts and completions. Since it usually takes over a year on average to complete a multi-family project, there is a lag between multi-family starts and completions. Completions are important because that is new supply added to the market, and starts are important because that is future new supply (units under construction is also important for employment).
These graphs use a 12 month rolling total for NSA starts and completions.

The rolling 12 month total for starts (blue line) increased steadily over the last few years - but has been moving more sideways recently. Completions (red line) have lagged behind - but completions have been generally catching up (more deliveries). Completions lag starts by about 12 months.
I think most of the growth in multi-family starts is probably behind us - in fact multi-family starts probably peaked in June 2015 (at 510 thousand SAAR) - although I expect solid multi-family starts for a few more years (based on demographics).
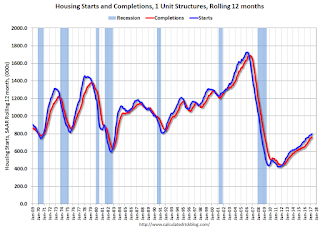
Note the exceptionally low level of single family starts and completions. The "wide bottom" was what I was forecasting several years ago, and now I expect a few years of increasing single family starts and completions.
MBA: Mortgage Delinquencies Decreased in Q1, Foreclosures Decreased
by Calculated Risk on 5/16/2017 10:39:00 AM
From the MBA: Delinquencies Decline in Latest MBA Mortgage Delinquency Survey
The delinquency rate for mortgage loans on one- to four-unit residential properties decreased to a seasonally adjusted rate of 4.71 percent of all loans outstanding at the end of the first quarter of 2017. The delinquency rate was down nine basis points from the previous quarter, and was six basis points lower than one year ago, according to the Mortgage Bankers Association's (MBA) National Delinquency Survey.
The percentage of loans on which foreclosure actions were started during the first quarter was 0.30 percent, an increase of two basis points from the previous quarter, but five basis points lower than one year ago.
The delinquency rate includes loans that are at least one payment past due but does not include loans in the process of foreclosure. The percentage of loans in the foreclosure process at the end of the first quarter was 1.39 percent, down 14 basis points from the fourth quarter and 35 basis points lower than one year ago.
The serious delinquency rate, the percentage of loans that are 90 days or more past due or in the process of foreclosure, was 2.76 percent, a decrease of 37 basis points from last quarter, and a decrease of 53 basis points from last year.
Marina Walsh, MBA's Vice President of Industry Analysis, offered the following commentary on the survey:
"Mortgage delinquencies decreased overall in the first quarter of 2017, driven by a drop in both the FHA and VA delinquency rates from the previous quarter as the conventional delinquency rate held constant. Employment growth started 2017 on strong footing, with the economy adding 216,000 jobs in January 2017 and 232,000 jobs in February. Average hourly wage growth increased 2.8 percent over the year, and has maintained a generally increasing trend since late 2015. These fundamentals have helped to support the performance of all loan types - whether FHA, VA or conventional loans.
...
"In addition, nearly all states had a decrease in the percentage of loans in foreclosure in the first quarter. The overall percentage of loans in the process of foreclosure was 1.39 percent, its lowest level since the first quarter of 2007. While judicial states still had more than three times the percent of loans in foreclosure as non-judicial states, that measure declined to the lowest level since the fourth quarter of 2007."
emphasis added
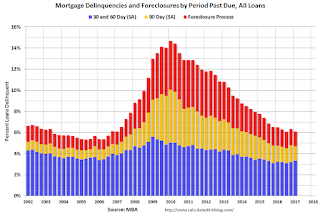 Click on graph for larger image.
This graph shows the percent of loans delinquent by days past due.
Note that the total percent delinquencies and foreclosures is below the 2002 level.
The percent of loans 30 and 60 days delinquent increased in Q1, but is below the normal historical level.
The 90 day bucket decreased in Q1, but remains a little elevated.
The percent of loans in the foreclosure process continues to decline, but is still above the historical average.
The 90 day bucket and foreclosure inventory are still elevated, but should be close to normal in 2017. Most other mortgage measures are already back to normal, however the lenders are still working through the backlog of bubble legacy loans - especially in judicial foreclosure states.
Industrial Production increased 1.0% in April
by Calculated Risk on 5/16/2017 09:23:00 AM
From the Fed: Industrial production and Capacity Utilization
Industrial production advanced 1.0 percent in April for its third consecutive monthly increase and its largest gain since February 2014. Manufacturing output rose 1.0 percent as a result of widespread increases among its major industries. The indexes for mining and utilities posted gains of 1.2 percent and 0.7 percent, respectively. At 105.1 percent of its 2012 average, total industrial production in April was 2.2 percent above its year-earlier level. Capacity utilization for the industrial sector increased 0.6 percentage point in April to 76.7 percent, a rate that is 3.2 percentage points below its long-run (1972–2016) average.
emphasis added
 Click on graph for larger image.
This graph shows Capacity Utilization. This series is up 10.0 percentage points from the record low set in June 2009 (the series starts in 1967).
Capacity utilization at 76.7% is 3.2% below the average from 1972 to 2015 and below the pre-recession level of 80.8% in December 2007.
Note: y-axis doesn't start at zero to better show the change.
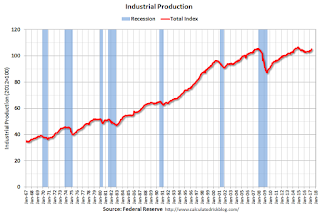 The second graph shows industrial production since 1967.
Industrial production increased in April to 105.1. This is 20.7% above the recession low, and is close to the pre-recession peak.
This was above expectations.
Housing Starts decreased to 1.172 Million Annual Rate in April
by Calculated Risk on 5/16/2017 08:42:00 AM
From the Census Bureau: Permits, Starts and Completions
Housing Starts:
Privately-owned housing starts in April were at a seasonally adjusted annual rate of 1,172,000. This is 2.6 percent below the revised March estimate of 1,203,000, but is 0.7 percent above the April 2016 rate of 1,164,000. Single-family housing starts in April were at a rate of 835,000; this is 0.4 percent above the revised March figure of 832,000. The April rate for units in buildings with five units or more was 328,000.
Building Permits:
Privately-owned housing units authorized by building permits in April were at a seasonally adjusted annual rate of 1,229,000. This is 2.5 percent below the revised March rate of 1,260,000, but is 5.7 percent above the April 2016 rate of 1,163,000. Single-family authorizations in April were at a rate of 789,000; this is 4.5 percent below the revised March figure of 826,000. Authorizations of units in buildings with five units or more were at a rate of 403,000 in April.
emphasis added
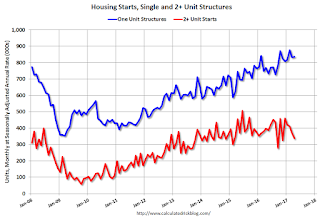 Click on graph for larger image.
The first graph shows single and multi-family housing starts for the last several years.
Multi-family starts (red, 2+ units) decreased in April compared to March. Multi-family starts are down year-over-year.
Multi-family is volatile.
Single-family starts (blue) increased in April, and are up 8.8% year-over-year.
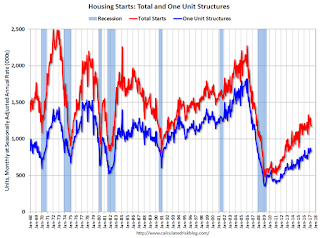 The second graph shows total and single unit starts since 1968.
 The second graph shows the huge collapse following the housing bubble, and then - after moving sideways for a couple of years - housing is now recovering (but still historically low),
Total housing starts in April were below expectations. This decline was due to a sharp decline in multi-family. Still a decent report. I'll have more later ...
Monday, May 15, 2017
Tuesday: Housing Starts, Industrial Production
by Calculated Risk on 5/15/2017 08:03:00 PM
Tuesday:
• At 8:30 AM ET, Housing Starts for April. The consensus is for 1.256 million, up from the March rate of 1.215 million.
• At 9:15 AM, The Fed will release Industrial Production and Capacity Utilization for April.The consensus is for a 0.4% increase in Industrial Production, and for Capacity Utilization to increase to 76.3%.
Early Q2 GDP Forecasts
by Calculated Risk on 5/15/2017 01:05:00 PM
From the Altanta Fed: GDPNow
The GDPNow model forecast for real GDP growth (seasonally adjusted annual rate) in the second quarter of 2017 is 3.6 percent on May 12, unchanged from May 9. The forecast for second-quarter real consumer spending inched up from 2.7 percent to 2.8 percent after [last week's] retail sales release from the U.S. Census Bureau and [last week's] Consumer Price Index report from the U.S. Bureau of Labor Statistics.From the NY Fed Nowcasting Report
emphasis added
The FRBNY Staff Nowcast stands at 1.9% for 2017:Q2.


