by Calculated Risk on 6/11/2017 08:01:00 PM
Sunday, June 11, 2017
Sunday Night Futures
Weekend:
• Schedule for Week of June 11, 2017
• My FOMC preview.
• Excerpts from Goldman's FOMC preview.
From CNBC: Pre-Market Data and Bloomberg futures: S&P futures are down 4 and DOW futures down 32 (fair value).
Oil prices were down over the last week with WTI futures at $45.94 per barrel and Brent at $48.15 per barrel. A year ago, WTI was at $49, and Brent was at $49 - so oil prices are DOWN year-over-year.
Here is a graph from Gasbuddy.com for nationwide gasoline prices. Nationally prices are at $2.33 per gallon - a year ago prices were at $2.40 per gallon - so gasoline prices are down year-over-year.
FOMC Preview
by Calculated Risk on 6/11/2017 01:04:00 PM
The consensus is that the Fed will raise the Fed Funds Rate 25 bps following the FOMC meeting this coming week.
Since a rate hike is expected (and assuming it happens), the focus this month will be on the wording of the statement, the projections, and Fed Chair Janet Yellen's press conference.
From Goldman Sachs on the statement: "The statement will likely characterize economic activity as picking up but recognize that inflation slowed since earlier this year."
And from Goldman on the press conference: "The press conference should provide some clarity on whether the next tightening step after June will be balance sheet normalization or a third funds rate hike."
And from Merrill Lynch on the press conference: "We expect the press conference to be focused on balance sheet normalization. Chair Yellen is likely to be asked about the specifics of the balance sheet policy and to elaborate on the potential timing of implementation. ... We also expect Yellen to note that the recent weak data on inflation is likely transitory, but she may provide some hints that she has become a bit more concerned."
Here are the March FOMC projections.
The projection for GDP in 2017 will likely be either unchanged or revised down slightly. GDP in Q1 was at 1.2% annualized, and Q2 looks like around 2.3% to 3.0% based on current forecasts.
My guess is, as far as the impact of fiscal stimulus, the Fed will continue to wait and see what the actual proposals will be.
| GDP projections of Federal Reserve Governors and Reserve Bank presidents | |||
|---|---|---|---|
| Change in Real GDP1 | 2017 | 2018 | 2019 |
| Mar 2017 | 2.0 to 2.2 | 1.8 to 2.3 | 1.8 to 2.0 |
| Dec 2016 | 1.9 to 2.3 | 1.8 to 2.2 | 1.8 to 2.0 |
The unemployment rate was at 4.3% in May. So the unemployment rate for Q4 2017 will be revised down a few tenths of a percentage point. 2018 will probably be revised down too.
| Unemployment projections of Federal Reserve Governors and Reserve Bank presidents | |||
|---|---|---|---|
| Unemployment Rate2 | 2017 | 2018 | 2019 |
| Mar 2017 | 4.5 to 4.6 | 4.3 to 4.6 | 4.3 to 4.7 |
| Dec 2016 | 4.5 to 4.6 | 4.3 to 4.7 | 4.3 to 4.8 |
As of April, PCE inflation was up 1.7% from April 2016. It appears inflation might be revised down for 2017.
| Inflation projections of Federal Reserve Governors and Reserve Bank presidents | |||
|---|---|---|---|
| PCE Inflation1 | 2017 | 2018 | 2019 |
| Mar 2017 | 1.8 to 2.0 | 1.9 to 2.0 | 2.0 to 2.1 |
| Dec 2016 | 1.7 to 2.0 | 1.9 to 2.0 | 2.0 to 2.1 |
PCE core inflation was up 1.5% in April year-over-year. Core PCE inflation will probably be revised down for 2017.
| Core Inflation projections of Federal Reserve Governors and Reserve Bank presidents | |||
|---|---|---|---|
| Core Inflation1 | 2017 | 2018 | 2019 |
| Mar 2017 | 1.8 to 1.9 | 1.9 to 2.0 | 2.0 to 2.1 |
| Dec 2016 | 1.8 to 1.9 | 1.9 to 2.0 | 2.0 |
In general, it appears GDP and inflation might be revised down (GDP slightly), and the unemployment rate will be revised lower.
Saturday, June 10, 2017
Goldman: FOMC Preview
by Calculated Risk on 6/10/2017 05:41:00 PM
A few brief excerpts from a Goldman Sachs research note:
Another rate increase from the FOMC next week is now extremely likely ...CR Note: Almost all analysts expect a rate hike this week, even though inflation has fallen further below the Fed's target. A few key questions are: Does the FOMC see the dip in inflation as transitory? Will the Fed keep tightening if inflation stays below target? Will the next tightening step be another rate hike or balance sheet normalization?
The unemployment rate has fallen 0.4pp since the March meeting and our current activity indicator and real GDP estimates signal that above-trend output growth will produce further labor market improvement. But the year-over-year core PCE inflation is now 0.2pp lower than at the March meeting.
... The statement will likely characterize economic activity as picking up but recognize that inflation slowed since earlier this year. ...
The press conference should provide some clarity on whether the next tightening step after June will be balance sheet normalization or a third funds rate hike.
Schedule for Week of June 11, 2017
by Calculated Risk on 6/10/2017 08:11:00 AM
The key economic reports this week are May Housing Starts, Retail Sales and the Consumer Price Index (CPI).
For manufacturing, May industrial production, and the June New York, and Philly Fed manufacturing surveys, will be released this week.
The FOMC meets this week and is expected to announce a 25bps increase in the Fed Funds rate.
No major economic releases scheduled.
6:00 AM ET: NFIB Small Business Optimism Index for May.
8:30 AM: The Producer Price Index for May from the BLS. The consensus is for 0.1% increase in PPI, and a 0.2% increase in core PPI.
7:00 AM ET: The Mortgage Bankers Association (MBA) will release the results for the mortgage purchase applications index.
 8:30 AM ET: Retail sales for May will be released. The consensus is for a 0.2% increase in retail sales.
This graph shows retail sales since 1992 through April 2017.
8:30 AM: The Consumer Price Index for May from the BLS. The consensus is for no change in CPI, and a 0.2% increase in core CPI.
10:00 AM: Manufacturing and Trade: Inventories and Sales (business inventories) report for April. The consensus is for a 0.1% decrease in inventories.
2:00 PM: FOMC Meeting Announcement. The FOMC is expected to increase the Fed Funds rate 25 bps at this meeting.
2:00 PM: FOMC Forecasts This will include the Federal Open Market Committee (FOMC) participants' projections of the appropriate target federal funds rate along with the quarterly economic projections.
2:30 PM: Fed Chair Janet Yellen holds a press briefing following the FOMC announcement.
8:30 AM ET: The initial weekly unemployment claims report will be released. The consensus is for 242 thousand initial claims, down from 245 thousand the previous week.
8:30 AM: The New York Fed Empire State manufacturing survey for June. The consensus is for a reading of 5.0, up from -1.0.
8:30 AM: the Philly Fed manufacturing survey for June. The consensus is for a reading of 27.0, down from 38.8.
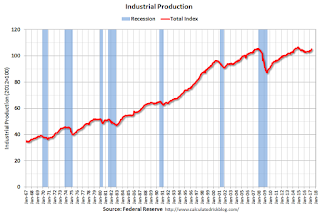
 9:15 AM: The Fed will release Industrial Production and Capacity Utilization for May.
This graph shows industrial production since 1967.
The consensus is for a 0.2% increase in Industrial Production, and for Capacity Utilization to increase to 76.8%.
10:00 AM: The June NAHB homebuilder survey. The consensus is for a reading of 70, unchanged from 70 in May. Any number above 50 indicates that more builders view sales conditions as good than poor.
 8:30 AM: Housing Starts for May. The consensus is for 1.221 million, up from the April rate of 1.172 million.
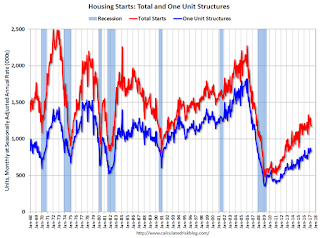
This graph shows total and single unit starts since 1968.
The graph shows the huge collapse following the housing bubble, and then - after moving sideways for a couple of years - housing is now recovering.
10:00 AM: Regional and State Employment and Unemployment (Monthly) for May 2017
10:00 AM: University of Michigan's Consumer sentiment index (preliminary for June). The consensus is for a reading of 97.1, unchanged from 97.1 in May.
Friday, June 09, 2017
Merrill FOMC Preview
by Calculated Risk on 6/09/2017 03:41:00 PM
The FOMC is expected to raise rate at their meeting next week. Here are a few brief excerpts from a Merrill Lynch preview:
The June FOMC meeting will be full of information. Most obviously, we think the Fed will hike rates by 25bp, as widely expected. It is possible – although quite unlikely – that a very weak CPI and retail sales report the morning of the 14th would discourage the Fed from delivering a hike. More likely, however, is that weak reports would influence the language in the statement and press conference.CR Note: I'll post a preview over the weekend.
...
The FOMC is likely to note that the pace of job growth has slowed while the unemployment rate has continued to decline, pointing to solid labor market fundamentals. We also expect the Fed to maintain language that indicates that the weakness in growth at the start of the year was likely transitory and activity is expected to accelerate. On inflation, we think the language will note that inflation has moved below target, but should continue to trend toward 2%. ...
We expect a number of changes to the projections. ... There will be particular interest in the outlook for inflation – we expect the median forecast for core PCE inflation to shift down to 1.7% for this year but think that the median will stay at 2.0% for 2018.
...
We expect the press conference to be focused on balance sheet normalization. Chair Yellen is likely to be asked about the specifics of the balance sheet policy and to elaborate on the potential timing of implementation. ... We also expect Yellen to note that the recent weak data on inflation is likely transitory, but she may provide some hints that she has become a bit more concerned.
Mortgage Equity Withdrawal slightly negative in Q1
by Calculated Risk on 6/09/2017 12:25:00 PM
Note: This is not Mortgage Equity Withdrawal (MEW) data from the Fed. The last MEW data from Fed economist Dr. Kennedy was for Q4 2008.
The following data is calculated from the Fed's Flow of Funds data (released today) and the BEA supplement data on single family structure investment. This is an aggregate number, and is a combination of homeowners extracting equity - hence the name "MEW" - and normal principal payments and debt cancellation (modifications, short sales, and foreclosures).
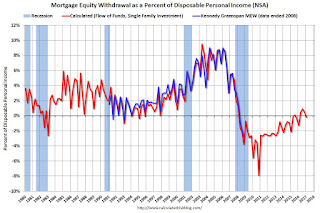
For Q1 2017, the Net Equity Extraction was a negative $7 billion, or a negative 0.02% of Disposable Personal Income (DPI) . Note that seasonally, Q1 is the usually the weakest quarter of the year equity extraction.

This graph shows the net equity extraction, or mortgage equity withdrawal (MEW), results, using the Flow of Funds (and BEA data) compared to the Kennedy-Greenspan method.
Note: This data is impacted by debt cancellation and foreclosures, but much less than a few years ago.
The Fed's Flow of Funds report showed that the amount of mortgage debt outstanding increased by $44 billion in Q4.
The Flow of Funds report also showed that Mortgage debt has declined by $1.22 trillion since the peak. This decline is mostly because of debt cancellation per foreclosures and short sales, and some from modifications. There has also been some reduction in mortgage debt as homeowners paid down their mortgages so they could refinance.
With a slower rate of debt cancellation, MEW will likely be positive going forward.
For reference:
Dr. James Kennedy also has a simple method for calculating equity extraction: "A Simple Method for Estimating Gross Equity Extracted from Housing Wealth". Here is a companion spread sheet (the above uses my simple method).
For those interested in the last Kennedy data included in the graph, the spreadsheet from the Fed is available here.
Goldman: "Prices and Risks in Commercial Real Estate"
by Calculated Risk on 6/09/2017 10:16:00 AM
A few excerpts from a research note by Goldman Sachs economists Spencer Hill and Daan Struyven: Seven Years of Feast: Prices and Risks in Commercial Real Estate
Commercial real estate prices have increased 76% in real terms over the last seven years and are now above pre-crisis levels. At the same time, elevated supply growth, demand risks, and rapid credit growth in some subsectors suggest additional focus on the asset class is warranted ... we believe commercial real estate valuations are becoming increasingly stretched and are now moderately overvalued – between 0.5 and 0.9 standard deviations rich – even after taking into account the lofty levels of other assets classes.CR Note: there are several warning signs for commercial real estate. As an example, even as the economy approaches full employment - and the demand for office space will likely slow - new construction is still strong and vacancy rates are already high.
...
[W]e think it’s important to note two key distinctions between the CRE market today and that of 2006. First, lending standards appear meaningfully tighter today ... Second, valuations do not look nearly as stretched today, with the extent of overvaluation 2-3x larger in 2006
[W]hile we believe commercial real estate markets were reasonably valued during most of this expansion, our models now suggest they could be moderately overvalued – even taking into account the lofty level of other assets classes. Furthermore, the combination of higher interest rates and potentially unfavorable supply & demand dynamics suggest heightened risk that the misvaluation could worsen. Indeed, these developments could ultimately become the catalysts that produce such a repricing.
 Click on graph for larger image.
This graph, based on data from Reis, shows the office vacancy rate starting in 1980 (prior to 1999 the data is annual).
Reis reported the vacancy rate was at 15.8% in Q1. The office vacancy rate is at the lowest level since early 2009, but remains elevated.
Slowing office demand, more supply and an already high vacancy rate imply weaker fundamentals going forward.
Thursday, June 08, 2017
AAR: Rail Traffic increased in May
by Calculated Risk on 6/08/2017 05:00:00 PM
From the Association of American Railroads (AAR) Rail Time Indicators. Graphs and excerpts reprinted with permission.
May 2017 was a good month for U.S. rail traffic. Total originated carloads were up 8.4% (99,290) over May 2017 thanks to big increases for coal (up 19.6% in May), grain (up 24.5%), and crushed stone, gravel, and sand (up 15.3%, thanks to frac sand). ... [Intermodal]: It was the second best May in history (slightly behind 2015) in terms of average weekly intermodal volume. Year-to-date intermodal in 2017 through May was the highest in history, fractionally ahead of 2015.
 Click on graph for larger image.
This graph from the Rail Time Indicators report shows U.S. average weekly rail carloads (NSA). Dark blue is 2017.
Rail carloads have been weak over the last decade due to the decline in coal shipments.
U.S. rail carloads rose 8.4% (99,290 carloads) in May 2017 over May 2016. The-glass-is-half-full types will point out that this is the seventh straight year-over-year monthly gain for total carloads, something that hasn’t happened since the seven months ending in January 2015 (see the chart below right). The glassis-half-empty types, though, will point out that average weekly total carloads in May 2017 (257,215) were the third lowest for May since 1988, when our data begin. (Only May 2009 and May 2016 were lower.)
 The second graph is for intermodal traffic (using intermodal or shipping containers):
U.S. rail intermodal volume in May 2017 was 1,339,417 containers and trailers, up 4.6%, or 58,665 units, over May 2016. Weekly average intermodal volume in May 2017 (267,883 units) was the second best for May in history (slightly behind 2015).
Leading Index for Commercial Real Estate Increases in May
by Calculated Risk on 6/08/2017 03:49:00 PM
Note: This index is possibly a leading indicator for new non-residential Commercial Real Estate (CRE) investment, except manufacturing.
From Dodge Data Analytics: Dodge Momentum Index Resumes Growth in May
Following a dip in April, the Dodge Momentum Index advanced 4.0% in May to 139.1 (2000=100) from its revised April reading of 133.7. The Momentum Index is a monthly measure of the first (or initial) report for nonresidential building projects in planning, which have been shown to lead construction spending for nonresidential buildings by a full year. In May, the commercial component of the Momentum Index increased 4.8% to an eight-and-a-half year high, which suggests that construction activity for commercial buildings will continue to rise over the next year, even with signs of decelerating improvement in market fundamentals (occupancies and rents). The institutional component of the Momentum Index rose 2.9% in May, making a partial rebound after pulling back 12.0% in April.
emphasis added
 Click on graph for larger image.
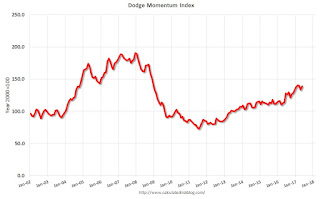
This graph shows the Dodge Momentum Index since 2002. The index was at 139.1 in May, up from 133.7 in April.
The index is up solidly year-over-year.
According to Dodge, this index leads "construction spending for nonresidential buildings by a full year". This suggests further increases in CRE spending over the next year.
Fed's Flow of Funds: Household Net Worth increased in Q1
by Calculated Risk on 6/08/2017 12:19:00 PM
The Federal Reserve released the Q1 2017 Flow of Funds report today: Flow of Funds.
According to the Fed, household net worth increased in Q1 2017 compared to Q4 2016:
The net worth of households and nonprofits rose to $94.8 trillion during the first quarter of 2017. The value of directly and indirectly held corporate equities increased $1.3 trillion and the value of real estate increased $0.5 trillion.Household net worth was at $94.8 trillion in Q1 2017, up from $92.5 trillion in Q4 2016.
The Fed estimated that the value of household real estate increased to $23.5 trillion in Q1. The value of household real estate is now above the bubble peak in early 2006 - but not adjusted for inflation, and this also includes new construction.
 Click on graph for larger image.
The first graph shows Households and Nonprofit net worth as a percent of GDP. Household net worth, as a percent of GDP, is higher than the peak in 2006 (housing bubble), and above the stock bubble peak.
This includes real estate and financial assets (stocks, bonds, pension reserves, deposits, etc) net of liabilities (mostly mortgages). Note that this does NOT include public debt obligations.
 This graph shows homeowner percent equity since 1952.
 Household percent equity (as measured by the Fed) collapsed when house prices fell sharply in 2007 and 2008.
In Q1 2017, household percent equity (of household real estate) was at 58.3% - up from Q4, and the highest since Q1 2006. This was because of an increase in house prices in Q1 (the Fed uses CoreLogic).
Note: about 30.3% of owner occupied households had no mortgage debt as of April 2010. So the approximately 50+ million households with mortgages have far less than 58.3% equity - and about 3 million homeowners still have negative equity.
 The third graph shows household real estate assets and mortgage debt as a percent of GDP.
 Mortgage debt increased by $44 billion in Q1.
Mortgage debt has declined by $1.22 trillion from the peak. Studies suggest most of the decline in debt has been because of foreclosures (or short sales), but some of the decline is from homeowners paying down debt (sometimes so they can refinance at better rates).
The value of real estate, as a percent of GDP, was up in Q1, and is above the average of the last 30 years (excluding bubble). However, mortgage debt as a percent of GDP, continues to decline.


