by Calculated Risk on 7/06/2017 08:20:00 AM
Thursday, July 06, 2017
ADP: Private Employment increased 158,000 in June
Private sector employment increased by 158,000 jobs from May to June according to the June ADP National Employment Report®. ... The report, which is derived from ADP’s actual payroll data, measures the change in total nonfarm private employment each month on a seasonally-adjusted basis.This was below the consensus forecast for 178,000 private sector jobs added in the ADP report.
...
“Despite a slight moderation in the month of June, the labor market remains strong,” said Ahu Yildirmaz, vice president and co-head of the ADP Research Institute. “For the month of June, jobs were primarily created in the service-providing sector.”
Mark Zandi, chief economist of Moody’s Analytics, said, “The job market continues to power forward. Abstracting from the monthly ups and downs, job growth remains a stalwart between 150,000 and 200,000. At this pace, which is double the rate of labor force growth, the tight labor market will continue getting tighter.”
The BLS report for June will be released Friday, and the consensus is for 170,000 non-farm payroll jobs added in June.
MBA: Mortgage Applications Increase in Latest Weekly Survey
by Calculated Risk on 7/06/2017 07:00:00 AM
From the MBA: Mortgage Applications Increase in Latest MBA Weekly Survey
Mortgage applications increased 1.4 percent from one week earlier, according to data from the Mortgage Bankers Association’s (MBA) Weekly Mortgage Applications Survey for the week ending June 30, 2017.
... The Refinance Index decreased 0.4 percent from the previous week. The seasonally adjusted Purchase Index increased 3 percent from one week earlier. The unadjusted Purchase Index increased 3 percent compared with the previous week and was 6 percent higher than the same week one year ago. ...
The average contract interest rate for 30-year fixed-rate mortgages with conforming loan balances ($424,100 or less) increased to its highest level since May 2017, 4.20 percent, from 4.13 percent, with points decreasing to 0.31 from 0.32 (including the origination fee) for 80 percent loan-to-value ratio (LTV) loans.
emphasis added
 Click on graph for larger image.
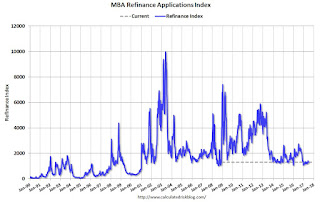
The first graph shows the refinance index since 1990.
Refinance activity is mostly moving sideways at a low level this year, and will not increase significantly unless rates fall well below 4%.
 The second graph shows the MBA mortgage purchase index.
 According to the MBA, purchase activity is up 6% year-over-year.
Wednesday, July 05, 2017
Thursday: Unemployment Claims, ADP Employment, Trade Deficit, ISM non-Mfg Survey
by Calculated Risk on 7/05/2017 07:21:00 PM
From Matthew Graham at Mortgage News Daily: Mortgage Rates Finally Catch a Break
Mortgage rates had been rising at an uncomfortable pace since June 27th. As of Monday, the average conventional 30yr fixed rate quote was 0.125% higher in 5 business days. That's a fairly abrupt move--especially when compared with almost any other 5-day stretch. In any event, it was the biggest 5-day move seen since the Presidential election.Thursday:
...
Today was the first day that bond markets (which dictate rates) were able to fight back. [top tier scenarios 30YR FIXED - 4.125%]
emphasis added
• At 7:00 AM, The Mortgage Bankers Association (MBA) will release the results for the mortgage purchase applications index.
• At 8:15 AM, The ADP Employment Report for June. This report is for private payrolls only (no government). The consensus is for 178,000 payroll jobs added in June, down from 253,000 added in May.
• At 8:30 AM, The initial weekly unemployment claims report will be released. The consensus is for 244 thousand initial claims, unchanged from 244 thousand the previous week.
• Also at 8:30 AM, Trade Balance report for May from the Census Bureau. The consensus is for the U.S. trade deficit to be at $46.2 billion in May from $47.6 billion in April.
• At 10:00 AM, the ISM non-Manufacturing Index for June. The consensus is for index to decrease to 56.5 from 56.9 in May.
FOMC Minutes: Inflation Discussions
by Calculated Risk on 7/05/2017 02:09:00 PM
From the Fed: Minutes of the Federal Open Market Committee, June 13-14, 2017. Excerpts:
With regard to the outlook for inflation, some participants emphasized downside risks, particularly in light of the recent low readings on inflation along with measures of inflation compensation and some survey measures of inflation expectations that were still low. However, a couple of participants expressed concern that a substantial undershooting of the longer-run normal rate of unemployment could pose an appreciable upside risk to inflation or give rise to macroeconomic or financial imbalances that eventually could lead to a significant economic downturn. Participants agreed that the Committee should continue to monitor inflation developments closely.
...
Several participants endorsed a policy approach, such as that embedded in many participants' projections, in which the unemployment rate would undershoot their current estimates of the longer-term normal rate for a sustained period. They noted that the longer-run normal rate of unemployment is difficult to measure and that recent evidence suggested resource pressures generated only modest responses of nominal wage growth and inflation. Against this backdrop, possible benefits cited by policymakers of a period of tight labor markets included a further rise in nominal wage growth that would bolster inflation expectations and help push the inflation rate closer to the Committee's 2 percent longer-run goal, as well as a stimulus to labor market participation and business fixed investment. It was also suggested that the symmetry of the Committee's inflation goal might be underscored if inflation modestly exceeded 2 percent for a time, as such an outcome would follow a long period in which inflation had undershot the 2 percent longer-term objective. Several participants expressed concern that a substantial and sustained unemployment undershooting might make the economy more likely to experience financial instability or could lead to a sharp rise in inflation that would require a rapid policy tightening that, in turn, could raise the risk of an economic downturn. However, other participants noted that if a sharp rise in inflation or inflation expectations did occur, the Committee could readily respond using conventional monetary policy tools.
emphasis added
Office Vacancy Rate and Office Investment
by Calculated Risk on 7/05/2017 12:54:00 PM
Last week Reis reported the office vacancy rate was unchanged at 16.0% in Q2, from 16.0% in Q1.
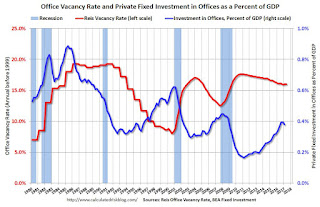
A key question is whether office investment will increase further (as a percent of GDP). The following graph shows the office vacancy rate and office investment as a percent of GDP. Note: Office investment also includes improvements.
Here are some comments from Reis Economist Barbara Byrne Denham on Q2:
Continuing its lackluster pace, the Office market recorded the lowest quarterly net absorption in three years as the vacancy rate remained flat at 16.0%. One year ago, the vacancy rate was 16.1%. In the last expansion, the U.S. vacancy rate had fallen from a high of 17.0% in 2003 to a low of 12.5% in 2007. In the current expansion that is now seven quarters longer than the previous expansion, the vacancy rate has fallen from a high of 17.6% to only 16.0% as tenants have leased far fewer square feet per added employee than in past cycles.
...
Overall office employment growth for U.S. metro areas in 2017 has grown at a slightly slower but still healthy rate of 2.0%. Thus, we expect occupancy growth to remain positive in 2017. We expect stronger construction in 2017 than in 2016 which means that the vacancy rate could continue to stay flat as occupancy grows at or near the same pace as new completions just as it has over the last two years. This has kept rent growth low and should continue to do so this year and next.
 Click on graph for larger image.
This graph shows the office vacancy rate starting in 1980 (prior to 1999 the data is annual). Back in the early '80s, there was overbuilding in the office sector even as the vacancy rate was rising. This was due to the very loose lending that led to the S&L crisis.
In the '90s, office investment picked up as the vacancy rate fell. Following the bursting of the stock bubble, the vacancy rate increased sharply and office investment declined.
During the housing bubble, office investment started to increase even before the vacancy rate had fallen below 14%. This was due to loose lending - again. Investment essentially stopped following the financial crisis.
Office investment has been increasing, and is now above the levels of previous slow periods. However the vacancy rate is still very high, suggesting office investment will not increase significantly going forward.
Office vacancy data courtesy of Reis.
Update: Framing Lumber Prices Up Year-over-year
by Calculated Risk on 7/05/2017 10:06:00 AM
Here is another update on framing lumber prices. Early in 2013 lumber prices came close to the housing bubble highs - and prices are once again near the bubble highs.
The price increases in early 2013 were due to a surge in demand (more housing starts) and supply constraints (framing lumber suppliers were working to bring more capacity online).
Prices didn't increase as much early in 2014 (more supply, smaller "surge" in demand).
In 2015, even with the pickup in U.S. housing starts, prices were down year-over-year. Note: Multifamily starts do not use as much lumber as single family starts, and there was a surge in multi-family starts. This decline in 2015 was also probably related to weakness in China.
Prices in 2017 are up solidly year-over-year.

This graph shows two measures of lumber prices: 1) Framing Lumber from Random Lengths through June 2017 (via NAHB), and 2) CME framing futures.
Right now Random Lengths prices are up 14% from a year ago, and CME futures are up about 18% year-over-year.
There is a seasonal pattern for lumber prices. Prices frequently peak around May, and bottom around October or November - although there is quite a bit of seasonal variability.
Tuesday, July 04, 2017
Wednesday: FOMC Minutes
by Calculated Risk on 7/04/2017 06:55:00 PM
Happy July 4th!
Wednesday:
• At 2:00 PM: FOMC Minutes for the Meeting of June 13 - 14, 2017
Hotels: Hotel Occupancy down Year-over-Year
by Calculated Risk on 7/04/2017 11:11:00 AM
From HotelNewsNow.com: STR: US hotel results for week ending 24 June
The U.S. hotel industry reported mixed year-over-year results in the three key performance metrics during the week of 18-24 June 2017, according to data from STR.The following graph shows the seasonal pattern for the hotel occupancy rate using the four week average.
In comparison with the week of 19-25 June 2016, the industry recorded the following:
• Occupancy: -1.2% to 75.8%
• Average daily rate (ADR): +1.1% to US$129.73
• Revenue per available room (RevPAR): -0.1% to US$98.31
emphasis added
 The red line is for 2017, dashed is 2015 (best year on record), blue is the median, and black is for 2009 (the worst year since the Great Depression for hotels).
Currently the occupancy rate is tracking close to last year, and behind the record year in 2015.
For hotels, occupancy will be strong over the next couple of months.
Data Source: STR, Courtesy of HotelNewsNow.com
Monday, July 03, 2017
U.S. Light Vehicle Sales at 16.4 million annual rate in June
by Calculated Risk on 7/03/2017 02:07:00 PM
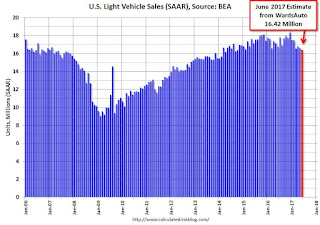
Based on a preliminary estimate from WardsAuto (ex-Porsche and Volvo), light vehicle sales were at a 16.42 million SAAR in June.
That is down 2% from June 2016, and down 1% from last month.
Click on graph for larger image.
This graph shows the historical light vehicle sales from the BEA (blue) and an estimate for May (red, light vehicle sales of 16.42 million SAAR mostly from WardsAuto).
This was below the consensus forecast of 16.6 million for May.
After two consecutive years of record sales, sales will be down in 2017.

Note: dashed line is current estimated sales rate.
Construction Spending unchanged in May
by Calculated Risk on 7/03/2017 11:57:00 AM
Earlier today, the Census Bureau reported that overall construction spending was unchanged in May:
Construction spending during May 2017 was estimated at a seasonally adjusted annual rate of $1,230.1 billion, nearly the same as the revised April estimate of $1,230.4 billion. The May figure is 4.5 percent above the May 2016 estimate of $1,177.0 billion.Private spending decreased and public spending increased in May:
Spending on private construction was at a seasonally adjusted annual rate of $943.2 billion, 0.6 percent below the revised April estimate of $949.3 billion. ...
In May, the estimated seasonally adjusted annual rate of public construction spending was $286.9 billion, 2.1 percent above the revised April estimate of $281.0 billion.
emphasis added
 Click on graph for larger image.
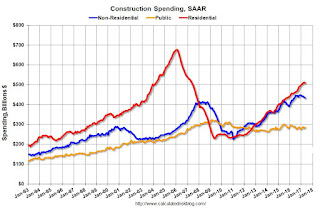
This graph shows private residential and nonresidential construction spending, and public spending, since 1993. Note: nominal dollars, not inflation adjusted.
Private residential spending has been increasing, and is still 25% below the bubble peak.
Non-residential spending is now 5% above the previous peak in January 2008 (nominal dollars).
Public construction spending is now 12% below the peak in March 2009, and 9% above the austerity low in February 2014.
 The second graph shows the year-over-year change in construction spending.
On a year-over-year basis, private residential construction spending is up 11%. Non-residential spending is up slightly year-over-year. Public spending is down slightly year-over-year.
This was below the consensus forecast of a 0.5% increase for May, however spending for previous months were revised up.


