by Calculated Risk on 10/20/2017 08:00:00 PM
Friday, October 20, 2017
Yellen: "A Challenging Decade and a Question for the Future"
From Fed Chair Janet Yellen: A Challenging Decade and a Question for the Future. Excerpt:
A Key Question for the Future
As the financial crisis and Great Recession fade into the past and the stance of monetary policy gradually returns to normal, a natural question concerns the possible future role of the unconventional policy tools we deployed after the onset of the crisis. My colleagues on the FOMC and I believe that, whenever possible, influencing short-term interest rates by targeting the federal funds rate should be our primary tool. As I have already noted, we have a long track record using this tool to pursue our statutory goals. In contrast, we have much more limited experience with using our securities holdings for that purpose.
Where does this assessment leave our unconventional policy tools? I believe their deployment should be considered again if our conventional tool reaches its limit--that is, when the federal funds rate has reached its effective lower bound and the U.S. economy still needs further monetary policy accommodation.
Does this mean that it will take another Great Recession for our unconventional tools to be used again? Not necessarily. Recent studies suggest that the neutral level of the federal funds rate appears to be much lower than it was in previous decades. Indeed, most FOMC participants now assess the longer-run value of the neutral federal funds rate as only 2-3/4 percent or so, compared with around 4-1/4 percent just a few years ago. With a low neutral federal funds rate, there will typically be less scope for the FOMC to reduce short-term interest rates in response to an economic downturn, raising the possibility that we may need to resort again to enhanced forward rate guidance and asset purchases to provide needed accommodation.
Of course, substantial uncertainty surrounds any estimates of the neutral level of short-term interest rates. In this regard, there is an important asymmetry to consider. If the neutral rate turns out to be significantly higher than we currently estimate, it is less likely that we will have to deploy our unconventional tools again. In contrast, if the neutral rate is as low as we estimate or even lower, we will be glad to have our unconventional tools in our toolkit.
The bottom line is that we must recognize that our unconventional tools might have to be used again. If we are indeed living in a low-neutral-rate world, a significantly less severe economic downturn than the Great Recession might be sufficient to drive short-term interest rates back to their effective lower bound.
Oil Rigs "The US oil rig count was crushed this week"
by Calculated Risk on 10/20/2017 05:23:00 PM
A few comments from Steven Kopits of Princeton Energy Advisors LLC on Oct 20, 2017:
• The US oil rig count was crushed this week
• Total US oil rigs were down 7 to 736
• Horizontal oil rigs were down 10 to 638, the worst week for horizontal rigs since March 2016
...
• The loss of rigs is consistent with our lagged WTI model (below), but the scale of the decline this week was stunning.
 Click on graph for larger image.
CR note: This graph shows the US horizontal rig count by basin.
Graph and comments Courtesy of Steven Kopits of Princeton Energy Advisors LLC.
Q3 GDP Forecasts
by Calculated Risk on 10/20/2017 02:52:00 PM
From the Altanta Fed: GDPNow
The GDPNow model forecast for real GDP growth (seasonally adjusted annual rate) in the third quarter of 2017 is 2.7 percent on October 18, unchanged from October 13. The forecast of third-quarter real residential investment growth inched down from -4.1 percent to -4.3 percent after this morning's new residential construction release from the U.S. Census Bureau.From the NY Fed Nowcasting Report
emphasis added
The New York Fed Staff Nowcast stands at 1.5% for 2017:Q3 and 2.6% for 2017:Q4From Merrill Lynch:
We revise up our 3Q GDP forecast to 3.0% marking to market with our tracking estimate.CR Note: The BEA is scheduled to release the advance estimate for Q3 GDP next week. Based on the August report, PCE looks sluggish in Q3 (mid-month method at 1.7%).
A Few Comments on September Existing Home Sales
by Calculated Risk on 10/20/2017 12:35:00 PM
Earlier: NAR: "Existing-Home Sales Inch 0.7 Percent Higher in September"
First, as usual, housing economist Tom Lawler's estimate was much closer to the NAR report than the consensus. So the slight month-to-month increase in reported sales, in September, was no surprise for CR readers.
My view is a sales rate of 5.39 million is solid. In fact, I'd consider any existing home sales rate in the 5 to 5.5 million range solid based on the normal historical turnover of the existing stock. As always, it is important to remember that new home sales are more important for jobs and the economy than existing home sales. Since existing sales are existing stock, the only direct contribution to GDP is the broker's commission. There is usually some additional spending with an existing home purchase - new furniture, etc. - but overall the economic impact is small compared to a new home sale.
Inventory is still very low and falling year-over-year (down 6.4% year-over-year in September). Inventory has declined year-over-year for 28 consecutive months. I started the year expecting inventory would be increasing year-over-year by the end of 2017. That now seems unlikely.
However this was the lowest year-over-year decline this year, and inventory could bottom this year. Inventory is a key metric to watch. More inventory would probably mean smaller price increases, and less inventory somewhat larger price increases.
The following graph shows existing home sales Not Seasonally Adjusted (NSA).
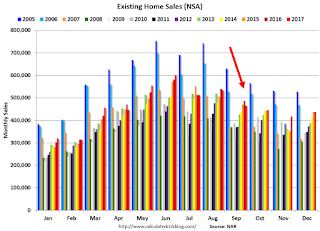
Sales NSA in September (465,000, red column) were below sales in September 2016 (486,000, NSA) and sales in September 2015 (471,000).
Sales NSA are now slowing seasonally, and sales NSA will be lower in Q4.
BLS: Unemployment Rates Lower in 11 states in September; Tennessee and Idaho at New Series Lows
by Calculated Risk on 10/20/2017 11:15:00 AM
Note from the BLS on Puerto Rico (due to ongoing catastrophe):
Due to Hurricanes Irma and Maria, Puerto Rico was not able to conduct normal data collection for either its household or establishment surveys for September. Likewise, the U.S. Virgin Islands was not able to administer its establishment survey for September. National estimates do not include Puerto Rico or the U.S. Virgin Islands.From the BLS: Regional and State Employment and Unemployment Summary
Unemployment rates were lower in September in 11 states, higher in 4 states, and stable in 35 states and the District of Columbia, the U.S. Bureau of Labor Statistics reported today. Twenty-two states had jobless rate decreases from a year earlier, 1 state had an increase, and 27 states and the District had little or no change. The national unemployment rate declined by 0.2 percentage point from August to 4.2 percent and was 0.7 point lower than in September 2016.
...
North Dakota had the lowest unemployment rate in September, 2.4 percent, closely followed by Colorado and Hawaii, 2.5 percent each. The rates in Idaho (2.8 percent) and Tennessee (3.0 percent) set new series lows. (All state series begin in 1976.) Alaska had the highest jobless rate, 7.2 percent.
emphasis added
 Click on graph for larger image.
This graph shows the current unemployment rate for each state (red), and the max during the recession (blue). All states are well below the maximum unemployment rate for the recession.
The size of the blue bar indicates the amount of improvement. The yellow squares are the lowest unemployment rate per state since 1976.
Thirteen states have reached new all time lows since the end of the 2007 recession. These thirteen states are: Alabama, Arkansas, California, Colorado, Idaho, Maine, Mississippi, North Dakota, Oregon, Tennessee, Texas, Washington, and Wisconsin.
The states are ranked by the highest current unemployment rate. Alaska, at 7.2%, had the highest state unemployment rate.
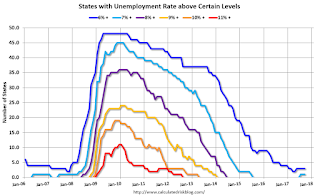 The second graph shows the number of states (and D.C.) with unemployment rates at or above certain levels since January 2006. At the worst of the employment recession, there were 11 states with an unemployment rate at or above 11% (red).
Currently one state has an unemployment rate at or above 7% (light blue); Only two states and D.C. are at or above 6% (dark blue). The states are Alaska (7.2%) and New Mexico (6.2%). D.C. is at 6.5%.
NAR: "Existing-Home Sales Inch 0.7 Percent Higher in September"
by Calculated Risk on 10/20/2017 10:17:00 AM
From the NAR: Existing-Home Sales Inch 0.7 Percent Higher in September
After three straight monthly declines, existing-home sales slightly reversed course in September, but ongoing supply shortages and recent hurricanes muted overall activity and caused sales to fall back on an annual basis, according to the National Association of Realtors®.
Total existing-home sales, which are completed transactions that include single-family homes, townhomes, condominiums and co-ops, rose 0.7 percent to a seasonally adjusted annual rate of 5.39 million in September from 5.35 million in August. Last month's sales pace is 1.5 percent below a year ago and is the second slowest over the past year (behind August).
...
Total housing inventory at the end of September rose 1.6 percent to 1.90 million existing homes available for sale, but still remains 6.4 percent lower than a year ago (2.03 million) and has fallen year-over-year for 28 consecutive months. Unsold inventory is at a 4.2-month supply at the current sales pace, which is down from 4.5 months a year ago.
emphasis added
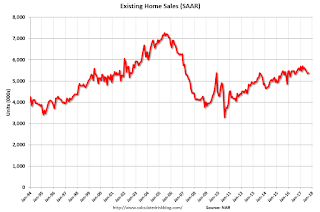 Click on graph for larger image.
This graph shows existing home sales, on a Seasonally Adjusted Annual Rate (SAAR) basis since 1993.
Sales in September (5.39 million SAAR) were 0.7% higher than last month, and were 1.5% below the September 2016 rate.
The second graph shows nationwide inventory for existing homes.
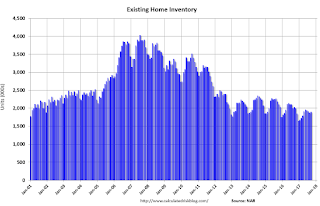 According to the NAR, inventory increased to 1.90 million in September from 1.87 million in August. Headline inventory is not seasonally adjusted, and inventory usually decreases to the seasonal lows in December and January, and peaks in mid-to-late summer.
The last graph shows the year-over-year (YoY) change in reported existing home inventory and months-of-supply. Since inventory is not seasonally adjusted, it really helps to look at the YoY change. Note: Months-of-supply is based on the seasonally adjusted sales and not seasonally adjusted inventory.
 Inventory decreased 6.4% year-over-year in September compared to September 2016.
 Months of supply was at 4.2 months in September.
As expected, sales were above the consensus view. For existing home sales, a key number is inventory - and inventory is still low. I'll have more later ...
Thursday, October 19, 2017
Friday: Existing Home Sales, Yellen Speech
by Calculated Risk on 10/19/2017 07:19:00 PM
Note: It is possible that a new Fed Chair will be announced (or hopefully reappointed) on Friday. If not tomorrow, the announcement will probably happen any time during the next couple of weeks.
From Matthew Graham at Mortgage News Daily: Mortgage Rates Sideways to Slightly Higher
Mortgage rates were unchanged to slightly lower today. ... We're splitting hairs in the bigger picture, however, as rates are still in a very narrow range in general. Few borrowers will have seen any change in their quoted rates. Most adjustments have come in the form of slightly higher/lower closing costs over the past few weeks. [30YR FIXED - 3.875-4.0%]Friday:
• At 10:00 AM ET, Existing Home Sales for September from the National Association of Realtors (NAR). The consensus is for 5.30 million SAAR, down from 5.35 million in August. Housing economist Tom Lawler expects the NAR to report sales of 5.38 million SAAR for September.
• Also at 10:00 AM, Regional and State Employment and Unemployment (Monthly) for September 2017
• At 7:30 PM, Speech by Fed Chair Janet Yellen, Monetary Policy Since the Financial Crisis, At the National Economists Club Herbert Stein Memorial Lecture and Annual Dinner, Washington, D.C
Existing Home Sales: Lawler vs. the Consensus
by Calculated Risk on 10/19/2017 03:21:00 PM
The NAR is scheduled to report September Existing Home Sales on Friday, October 20th at 10:00 AM ET.
The consensus, according to Bloomberg, is that the NAR will report sales of 5.30 million. Housing economist Tom Lawler estimates the NAR will report sales of 5.38 million on a seasonally adjusted annual rate (SAAR) basis, up slightly from 5.35 million SAAR in August.
Housing economist Tom Lawler has been sending me his predictions of what the NAR will report for over 7 years. The table below shows the consensus for each month, Lawler's predictions, and the NAR's initial reported level of sales.
Lawler hasn't always been closer than the consensus, but usually when there has been a fairly large spread between Lawler's estimate and the "consensus", Lawler has been closer.
NOTE: There have been times when Lawler "missed", but then he pointed out an apparent error in the NAR data - and the subsequent revision corrected that error. As an example, see: The “Curious Case” of Existing Home Sales in the South in April
Over the last seven years, the consensus average miss was 145 thousand, and Lawler's average miss was 70 thousand.
The consensus is close to Lawler's estimate this month, but I'd still take the over.
| Existing Home Sales, Forecasts and NAR Report millions, seasonally adjusted annual rate basis (SAAR) | |||
|---|---|---|---|
| Month | Consensus | Lawler | NAR reported1 |
| May-10 | 6.20 | 5.83 | 5.66 |
| Jun-10 | 5.30 | 5.30 | 5.37 |
| Jul-10 | 4.66 | 3.95 | 3.83 |
| Aug-10 | 4.10 | 4.10 | 4.13 |
| Sep-10 | 4.30 | 4.50 | 4.53 |
| Oct-10 | 4.50 | 4.46 | 4.43 |
| Nov-10 | 4.85 | 4.61 | 4.68 |
| Dec-10 | 4.90 | 5.13 | 5.28 |
| Jan-11 | 5.20 | 5.17 | 5.36 |
| Feb-11 | 5.15 | 5.00 | 4.88 |
| Mar-11 | 5.00 | 5.08 | 5.10 |
| Apr-11 | 5.20 | 5.15 | 5.05 |
| May-11 | 4.75 | 4.80 | 4.81 |
| Jun-11 | 4.90 | 4.71 | 4.77 |
| Jul-11 | 4.92 | 4.69 | 4.67 |
| Aug-11 | 4.75 | 4.92 | 5.03 |
| Sep-11 | 4.93 | 4.83 | 4.91 |
| Oct-11 | 4.80 | 4.86 | 4.97 |
| Nov-11 | 5.08 | 4.40 | 4.42 |
| Dec-11 | 4.60 | 4.64 | 4.61 |
| Jan-12 | 4.69 | 4.66 | 4.57 |
| Feb-12 | 4.61 | 4.63 | 4.59 |
| Mar-12 | 4.62 | 4.59 | 4.48 |
| Apr-12 | 4.66 | 4.53 | 4.62 |
| May-12 | 4.57 | 4.66 | 4.55 |
| Jun-12 | 4.65 | 4.56 | 4.37 |
| Jul-12 | 4.50 | 4.47 | 4.47 |
| Aug-12 | 4.55 | 4.87 | 4.82 |
| Sep-12 | 4.75 | 4.70 | 4.75 |
| Oct-12 | 4.74 | 4.84 | 4.79 |
| Nov-12 | 4.90 | 5.10 | 5.04 |
| Dec-12 | 5.10 | 4.97 | 4.94 |
| Jan-13 | 4.90 | 4.94 | 4.92 |
| Feb-13 | 5.01 | 4.87 | 4.98 |
| Mar-13 | 5.03 | 4.89 | 4.92 |
| Apr-13 | 4.92 | 5.03 | 4.97 |
| May-13 | 5.00 | 5.20 | 5.18 |
| Jun-13 | 5.27 | 4.99 | 5.08 |
| Jul-13 | 5.13 | 5.33 | 5.39 |
| Aug-13 | 5.25 | 5.35 | 5.48 |
| Sep-13 | 5.30 | 5.26 | 5.29 |
| Oct-13 | 5.13 | 5.08 | 5.12 |
| Nov-13 | 5.02 | 4.98 | 4.90 |
| Dec-13 | 4.90 | 4.96 | 4.87 |
| Jan-14 | 4.70 | 4.67 | 4.62 |
| Feb-14 | 4.64 | 4.60 | 4.60 |
| Mar-14 | 4.56 | 4.64 | 4.59 |
| Apr-14 | 4.67 | 4.70 | 4.65 |
| May-14 | 4.75 | 4.81 | 4.89 |
| Jun-14 | 4.99 | 4.96 | 5.04 |
| Jul-14 | 5.00 | 5.09 | 5.15 |
| Aug-14 | 5.18 | 5.12 | 5.05 |
| Sep-14 | 5.09 | 5.14 | 5.17 |
| Oct-14 | 5.15 | 5.28 | 5.26 |
| Nov-14 | 5.20 | 4.90 | 4.93 |
| Dec-14 | 5.05 | 5.15 | 5.04 |
| Jan-15 | 5.00 | 4.90 | 4.82 |
| Feb-15 | 4.94 | 4.87 | 4.88 |
| Mar-15 | 5.04 | 5.18 | 5.19 |
| Apr-15 | 5.22 | 5.20 | 5.04 |
| May-15 | 5.25 | 5.29 | 5.35 |
| Jun-15 | 5.40 | 5.45 | 5.49 |
| Jul-15 | 5.41 | 5.64 | 5.59 |
| Aug-15 | 5.50 | 5.54 | 5.31 |
| Sep-15 | 5.35 | 5.56 | 5.55 |
| Oct-15 | 5.41 | 5.33 | 5.36 |
| Nov-15 | 5.32 | 4.97 | 4.76 |
| Dec-15 | 5.19 | 5.36 | 5.46 |
| Jan-16 | 5.32 | 5.36 | 5.47 |
| Feb-16 | 5.30 | 5.20 | 5.08 |
| Mar-16 | 5.27 | 5.27 | 5.33 |
| Apr-16 | 5.40 | 5.44 | 5.45 |
| May-16 | 5.64 | 5.55 | 5.53 |
| Jun-16 | 5.48 | 5.62 | 5.57 |
| Jul-16 | 5.52 | 5.41 | 5.39 |
| Aug-16 | 5.44 | 5.49 | 5.33 |
| Sep-16 | 5.35 | 5.55 | 5.47 |
| Oct-16 | 5.44 | 5.47 | 5.60 |
| Nov-16 | 5.54 | 5.60 | 5.61 |
| Dec-16 | 5.54 | 5.55 | 5.49 |
| Jan-17 | 5.55 | 5.60 | 5.69 |
| Feb-17 | 5.55 | 5.41 | 5.48 |
| Mar-17 | 5.61 | 5.74 | 5.71 |
| Apr-17 | 5.67 | 5.56 | 5.57 |
| May-17 | 5.55 | 5.65 | 5.62 |
| Jun-17 | 5.58 | 5.59 | 5.52 |
| Jul-17 | 5.57 | 5.38 | 5.44 |
| Aug-17 | 5.48 | 5.39 | 5.35 |
| Sep-17 | 5.30 | 5.38 | --- |
| 1NAR initially reported before revisions. | |||
Earlier: Philly Fed Manufacturing Survey showed "Continued Growth" in October
by Calculated Risk on 10/19/2017 12:30:00 PM
Earlier from the Philly Fed: October 2017 Manufacturing Business Outlook Survey
Manufacturing firms reported continued growth in regional manufacturing in October. The survey’s current indicators for general activity, new orders, shipments, and employment all remained positive this month. Both of the survey’s current labor market indicators showed notable improvement. The indexes assessing the six-month outlook suggest that firms remained optimistic about future growth.Here is a graph comparing the regional Fed surveys and the ISM manufacturing index:
...
The index for current manufacturing activity in the region increased 4 points to a reading of 27.9 and is now at its highest reading since May ... Firms reported, on balance, an increase in manufacturing employment and longer workweeks this month.
emphasis added
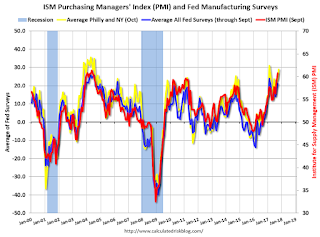 Click on graph for larger image.
The New York and Philly Fed surveys are averaged together (yellow, through October), and five Fed surveys are averaged (blue, through September) including New York, Philly, Richmond, Dallas and Kansas City. The Institute for Supply Management (ISM) PMI (red) is through September (right axis).
This suggests the ISM manufacturing index will show solid expansion in October.
Black Knight: "Hurricanes Irma and Harvey Drive Surge in Past-Due Mortgages"
by Calculated Risk on 10/19/2017 09:30:00 AM
From Black Knight: Black Knight’s First Look at September 2017 Mortgage Data: Hurricanes Irma and Harvey Drive Surge in Past-Due Mortgages
• Nationally, the number of non-current mortgages (those at least 30 days past-due or in active foreclosure) jumped by 214,000 (+9 percent), driven primarily by fallout from Hurricanes Harvey and IrmaAccording to Black Knight's First Look report for September, the percent of loans delinquent increased 11.9% in September compared to August, and increased 3.0% year-over-year.
• FEMA-declared hurricane disaster areas accounted for the bulk of the increases; non-current inventory rose by 84,000 (+48 percent) in Irma disaster areas and 52,000 (+67 percent) in those related to Harvey
• Prior to the hurricanes, Texas and Florida ranked 20th and 22nd among states by non-current mortgage rates; after the storms, they now rank 3rd and 5th respectively
• Primarily as a result of hurricane impact, September saw the first annual rise in mortgage delinquencies (borrowers at least 30 days past-due but not yet in active foreclosure) since July 2010
• Monthly foreclosure starts were at their lowest in more than 17 years, with starts down as much as 90 percent in areas covered by post-hurricane foreclosure action moratoria
The percent of loans in the foreclosure process declined 7.2% in September and were down 30.1% over the last year.
Black Knight reported the U.S. mortgage delinquency rate (loans 30 or more days past due, but not in foreclosure) was 4.40% in September, up from 3.93% in August.
The percent of loans in the foreclosure process declined in September to 0.70%.
The number of delinquent properties, but not in foreclosure, is up 80,000 properties year-over-year, and the number of properties in the foreclosure process is down 151,000 properties year-over-year.
| Black Knight: Percent Loans Delinquent and in Foreclosure Process | ||||
|---|---|---|---|---|
| Sept 2017 | Aug 2017 | Sept 2016 | Sept 2015 | |
| Delinquent | 4.40% | 3.93% | 4.27% | 4.87% |
| In Foreclosure | 0.70% | 0.76% | 1.00% | 1.46% |
| Number of properties: | ||||
| Number of properties that are delinquent, but not in foreclosure: | 2,245,000 | 2,003,000 | 2,165,000 | 2,457,000 |
| Number of properties in foreclosure pre-sale inventory: | 358,000 | 385,000 | 509,000 | 737,000 |
| Total Properties | 2,603,000 | 2,388,000 | 2,674,000 | 3,194,000 |


