by Calculated Risk on 11/30/2017 02:28:00 PM
Thursday, November 30, 2017
Earlier: Chicago PMI "Softens" in November
Earlier from the Chicago PMI: Chicago Business Barometer Softens to 63.9 in November
The MNI Chicago Business Barometer eased to 63.9 in November, down from 66.2 in October, to stand at the lowest level in three months.This was close to the consensus forecast of 64.0, and still a solid reading.
Despite receding from October’s six-and-a-half year high, optimism among businesses recorded the fourth highest outturn this year. The Barometer has expanded for 21 straight months and is poised to see out 2017 in solid fashion.
...
“Despite November’s fall, the MNI Chicago Business Barometer remains on track to deliver the first full year of expansion in three years. Firms seem to have navigated through the worst of the bad weather conditions in recent months, though supplier deliveries rising to a thirteen-year high and persistent, high input costs suggests the effects are yet to fully dissipate away,” said Jamie Satchi, Economist at MNI Indicators.
emphasis added
Hotel Occupancy Rate Increased Year-over-Year, On Pace for Record Year
by Calculated Risk on 11/30/2017 11:49:00 AM
From HotelNewsNow.com: STR: US hotel results for week ending 25 November
The U.S. hotel industry reported positive year-over-year results in the three key performance metrics during the week of 19-25 November 2017, according to data from STR.Note: The hurricanes continue to drive demand in Texas and Florida, especially in Houston.
In comparison with the week of 20-26 November 2016, the industry recorded the following:
• Occupancy: +1.4% to 51.4%
• Average daily rate (ADR): +2.0% to US$109.99
• Revenue per available room (RevPAR): +3.4% to US$56.52
Among the Top 25 Markets, Houston, Texas, reported the largest increase in all three key performance metrics: occupancy (+32.8% to 56.0%), ADR (+16.0% to US$92.58) and RevPAR (+54.1% to US$51.86).
emphasis added
The following graph shows the seasonal pattern for the hotel occupancy rate using the four week average.
 The red line is for 2017, dash light blue is 2016, dashed orange is 2015 (best year on record), blue is the median, and black is for 2009 (the worst year since the Great Depression for hotels).
Currently the occupancy rate, to date, is ahead of the record year in 2015. The hurricanes will push the annual occupancy rate to a new record in 2017.
Data Source: STR, Courtesy of HotelNewsNow.com
Personal Income increased 0.4% in October, Spending increased 0.3%
by Calculated Risk on 11/30/2017 08:48:00 AM
The BEA released the Personal Income and Outlays report for October:
Personal income increased $65.1 billion (0.4 percent) in October according to estimates released today by the Bureau of Economic Analysis. Disposable personal income (DPI) increased $66.1 billion (0.5 percent) and personal consumption expenditures (PCE) increased $34.4 billion (0.3 percent).The October PCE price index increased 1.6 percent year-over-year and the October PCE price index, excluding food and energy, increased 1.4 percent year-over-year.
...
Real DPI increased 0.3 percent in October and Real PCE increased 0.1 percent. The PCE price index increased 0.1 percent. Excluding food and energy, the PCE price index increased 0.2 percent.
The following graph shows real Personal Consumption Expenditures (PCE) through October 2017 (2009 dollars). Note that the y-axis doesn't start at zero to better show the change.
 Click on graph for larger image.
The dashed red lines are the quarterly levels for real PCE.
The increase in personal income was slightly above expectations, and the increase in PCE was at expectations.
Weekly Initial Unemployment Claims decrease to 238,000
by Calculated Risk on 11/30/2017 08:33:00 AM
The DOL reported:
In the week ending November 25, the advance figure for seasonally adjusted initial claims was 238,000, a decrease of 2,000 from the previous week's revised level. The previous week's level was revised up by 1,000 from 239,000 to 240,000. The 4-week moving average was 242,250, an increase of 2,250 from the previous week's revised average. The previous week's average was revised up by 250 from 239,750 to 240,000.The previous week was revised up.
Claims taking procedures continue to be disrupted in the Virgin Islands
emphasis added
The following graph shows the 4-week moving average of weekly claims since 1971.
 Click on graph for larger image.
The dashed line on the graph is the current 4-week average. The four-week average of weekly unemployment claims increased to 242,250.
This was slightly lower than the consensus forecast. The low level of claims suggest relatively few layoffs.
Wednesday, November 29, 2017
Thursday: Unemployment Claims, Personal Income and Outlays, Chicago PMI
by Calculated Risk on 11/29/2017 08:55:00 PM
Thursday:
• At 8:30 AM ET, The initial weekly unemployment claims report will be released. The consensus is for 240 thousand initial claims, up from 239 thousand the previous week.
• Also at 8:30 AM, Personal Income and Outlays for October. The consensus is for a 0.3% increase in personal income, and for a 0.3% increase in personal spending. And for the Core PCE price index to increase 0.2%.
• At 9:45 AM, Chicago Purchasing Managers Index for November. The consensus is for a reading of 64.0, down from 66.2 in October.
Policy Mistakes
by Calculated Risk on 11/29/2017 06:27:00 PM
Over the last 20 years or so, we've seen several policy mistakes. The worst, of course, was the decision to invade Iraq (I opposed the Iraq war, and was shouted down and called names like "Saddam lover" for questioning the veracity of the information). Note: I started this blog in January 2005, and one of my earliest non-housing posts was "A Desolation called Peace" (I'm still angry).
From an economic perspective, the errors include the failure to properly regulate the banks and mortgage lenders, the Bush tax cuts, the original TARP proposal, and some minor mistakes in 2009 like the homebuyers tax credit and "cash-for-clunkers". Also the premature pivot to austerity in 2010, and the failure to pass infrastructure spending programs in the following years, were clear policy mistakes.
We'd better off if we hadn't made these mistakes, but we survived.
The current tax cut bill is another clear policy mistake.
First, if we look at the business cycle and the deficit, economic theory suggests that the government should increase the deficit during economic downturns, and work down the deficit during expansions. The economy is currently in the mid-to-late stage of a recovery, so decreasing the deficit makes sense now - not increasing the deficit.
Are there any fiscal conservatives left in the GOP? There are definitely no deficit hawks!
Also, a key problem in the US is income and wealth inequality. How does this bill address these issues? It does the opposite.
Oh well, it looks like the US is about to make another policy mistake that will have to be reversed in a few years.
Freddie Mac: Mortgage Serious Delinquency rate unchanged in October
by Calculated Risk on 11/29/2017 12:43:00 PM
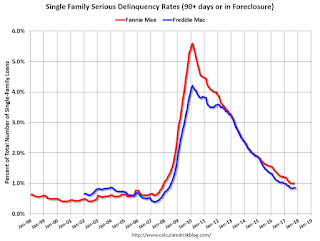
Freddie Mac reported that the Single-Family serious delinquency rate in October was at 0.86%, unchanged from 0.86% in September. Freddie's rate is down from 1.03% in October 2016.
Freddie's serious delinquency rate peaked in February 2010 at 4.20%.
These are mortgage loans that are "three monthly payments or more past due or in foreclosure".

The recent slight increase in the delinquency rate was probably due to the hurricanes - and we might see a further increase over the next couple of months (These are serious delinquencies).
After the hurricane bump, maybe the rate will decline another 0.2 to 0.3 percentage points or so to a cycle bottom, but this is pretty close to normal.
Note: Fannie Mae will report for October soon.
NAR: Pending Home Sales Index increase in October, Down 0.6% Year-over-year
by Calculated Risk on 11/29/2017 10:07:00 AM
From the NAR: Pending Home Sales Strengthen 3.5 Percent in October
Pending home sales rebounded strongly in October following three straight months of diminishing activity, but still continued their recent slide of falling behind year ago levels, according to the National Association of Realtors®. All major regions except for the West saw an increase in contract signings last month.This was above expectations of a 1.0% increase for this index. Note: Contract signings usually lead sales by about 45 to 60 days, so this would usually be for closed sales in November and December.
The Pending Home Sales Index, a forward-looking indicator based on contract signings, rose 3.5 percent to 109.3 in October from a downwardly revised 105.6 in September. The index is now at its highest reading since June (110.0), but is still 0.6 percent below a year ago.
...
The PHSI in the Northeast inched forward 0.5 percent to 95.0 in October, but is still 1.9 percent below a year ago. In the Midwest the index increased 2.8 percent to 105.8 in October, but remains 0.9 percent lower than October 2016.
Pending home sales in the South jumped 7.4 percent to an index of 123.6 in October and are now 2.0 percent higher than last October. The index in the West decreased 0.7 percent in October to 101.6, and is now 4.4 percent below a year ago.
emphasis added
Q3 GDP Revised up to 3.3% Annual Rate
by Calculated Risk on 11/29/2017 08:34:00 AM
From the BEA: Gross Domestic Product: Third Quarter 2017 (Second Estimate)
Real gross domestic product (GDP) increased at an annual rate of 3.3 percent in the third quarter of 2017, according to the "second" estimate released by the Bureau of Economic Analysis. In the second quarter, real GDP increased 3.1 percent.Here is a Comparison of Second and Advance Estimates. PCE growth was revised down from 2.4% to 2.3%. Residential investment was revised up slightly from -6.0% to -5.1%. This was at the consensus forecast.
The GDP estimate released today is based on more complete source data than were available for the "advance" estimate issued last month. In the advance estimate, the increase in real GDP was 3.0 percent. With this second estimate for the third quarter, the general picture of economic growth remains the same; nonresidential fixed investment, state and local government spending, and private inventory investment were revised up from the prior estimate ...
emphasis added
MBA: Mortgage Applications Decrease in Latest Weekly Survey
by Calculated Risk on 11/29/2017 07:00:00 AM
From the MBA: Mortgage Applications Decrease in Latest MBA Weekly Survey
Mortgage applications decreased 3.1 percent from one week earlier, according to data from the Mortgage Bankers Association’s (MBA) Weekly Mortgage Applications Survey for the week ending November 24, 2017. This week’s results include an adjustment for the Thanksgiving holiday.
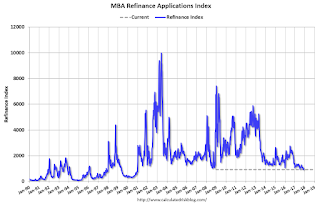
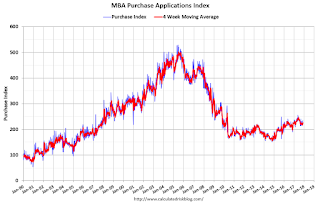
... The Refinance Index decreased 8 percent from the previous week to its lowest level since January 2017. The seasonally adjusted Purchase Index increased 2 percent from one week earlier to its highest level since September 2017. The unadjusted Purchase Index decreased 32 percent compared with the previous week and was 6 percent higher than the same week one year ago. ...
The average contract interest rate for 30-year fixed-rate mortgages with conforming loan balances ($424,100 or less) remained unchanged from the week prior at 4.20 percent, with points decreasing to 0.34 from 0.42 (including the origination fee) for 80 percent loan-to-value ratio (LTV) loans.
emphasis added
 Click on graph for larger image.
The first graph shows the refinance index since 1990.
Refinance activity will not pick up significantly unless mortgage rates fall well below 4%.
 The second graph shows the MBA mortgage purchase index.
 According to the MBA, purchase activity is up 6% year-over-year.


