by Calculated Risk on 12/13/2017 08:38:00 AM
Wednesday, December 13, 2017
BLS: CPI increased 0.4% in November, Core CPI increased 0.1%
The Consumer Price Index for All Urban Consumers (CPI-U) rose 0.4 percent in November on a seasonally adjusted basis, the U.S. Bureau of Labor Statistics reported today. Over the last 12 months, the all items index rose 2.2 percent.I'll post a graph later today after the Cleveland Fed releases the median and trimmed-mean CPI. This was at the consensus forecast of a 0.4% increase for CPI, and below the forecast of a 0.1% increase in core CPI.
...
The index for all items less food and energy increased 0.1 percent in November. ... The all items index rose 2.2 percent for the 12 months ending November. The index for all items less food and energy rose 1.7 percent, a slight decline from the 1.8-percent increase for the period ending October.
emphasis added
MBA: Mortgage Applications Decrease in Latest Weekly Survey
by Calculated Risk on 12/13/2017 07:00:00 AM
From the MBA: Mortgage Applications Decrease in Latest MBA Weekly Survey
Mortgage applications decreased 2.3 percent from one week earlier, according to data from the Mortgage Bankers Association’s (MBA) Weekly Mortgage Applications Survey for the week ending December 8, 2017.
... The Refinance Index decreased 3 percent from the previous week. The seasonally adjusted Purchase Index decreased 1 percent from one week earlier. The unadjusted Purchase Index decreased 6 percent compared with the previous week and was 10 percent higher than the same week one year ago. ...
The average contract interest rate for 30-year fixed-rate mortgages with conforming loan balances ($424,100 or less) increased to 4.20 percent from 4.19 percent, with points decreasing to 0.39 from 0.40 (including the origination fee) for 80 percent loan-to-value ratio (LTV) loans.
emphasis added
 Click on graph for larger image.
The first graph shows the refinance index since 1990.
Refinance activity will not pick up significantly unless mortgage rates fall well below 4%.
 The second graph shows the MBA mortgage purchase index.
 According to the MBA, purchase activity is up 10% year-over-year.
Tuesday, December 12, 2017
Wednesday: FOMC Announcement, CPI
by Calculated Risk on 12/12/2017 06:53:00 PM
Wednesday:
• At 7:00 AM ET, The Mortgage Bankers Association (MBA) will release the results for the mortgage purchase applications index.
• At 8:30 AM, The Consumer Price Index for November from the BLS. The consensus is for a 0.4% increase in CPI, and a 0.2% increase in core CPI.
• At 2:00 PM, FOMC Meeting Announcement. The FOMC is expected to increase the Fed Funds rate 25 bps at this meeting.
• Also at 2:00 PM, FOMC Forecasts This will include the Federal Open Market Committee (FOMC) participants' projections of the appropriate target federal funds rate along with the quarterly economic projections.
• At 2:30 PM, Fed Chair Janet Yellen holds a press briefing following the FOMC announcement.
LA area Port Traffic Surges in November
by Calculated Risk on 12/12/2017 03:45:00 PM
Container traffic gives us an idea about the volume of goods being exported and imported - and usually some hints about the trade report since LA area ports handle about 40% of the nation's container port traffic.
From the Port of Long Beach: Port Surges Past 2016 Cargo Volume
With just under one month left in 2017, the Port of Long Beach has already exceeded the cargo total for all of last year, and will handle more than 7 million containers for only the fourth time in its 106-year history....From the Port of Los Angeles: Port of Los Angeles Sets New Record for Highest Monthly Container Volumes
“U.S. consumers are confident and the economy has been strong,” said Long Beach Harbor Commission President Lou Anne Bynum. “Retailers have been stocking goods as a result and we are nearing cargo levels we have not seen since before the 2008 recession.”
The Port of Los Angeles moved 924,225 Twenty-Foot Equivalent Units (TEUs) in November, the most containerized monthly cargo the Port has processed during its 110-year history. The previous record of 877,564 TEUs was set in November 2016.The following graphs are for inbound and outbound traffic at the ports of Los Angeles and Long Beach in TEUs (TEUs: 20-foot equivalent units or 20-foot-long cargo container).
Eleven months through 2017, volumes are up 6.3 percent compared to last year’s record-breaking 8.8 million TEUs.
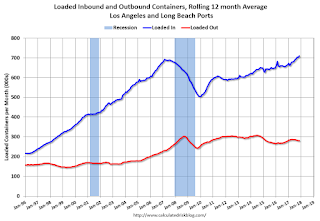
To remove the strong seasonal component for inbound traffic, the first graph shows the rolling 12 month average.
 Click on graph for larger image.
On a rolling 12 month basis, inbound traffic was up 0.9% compared to the rolling 12 months ending in October. Outbound traffic was up 0.2% compared to the rolling 12 months ending in October.
The 2nd graph is the monthly data (with a strong seasonal pattern for imports).
 Usually imports peak in the July to October period as retailers import goods for the Christmas holiday, and then decline sharply and bottom in February or March depending on the timing of the Chinese New Year.
 Trade has been strong - especially inbound - and setting record volumes most months recently. This suggests the retailers are optimistic about the Christmas Holiday shopping season.
In general imports have been increasing, and exports are mostly moving sideways to slightly down recently.
Mortgage Equity Withdrawal slightly positive in Q3
by Calculated Risk on 12/12/2017 12:24:00 PM
Note: This is not Mortgage Equity Withdrawal (MEW) data from the Fed. The last MEW data from Fed economist Dr. Kennedy was for Q4 2008.
The following data is calculated from the Fed's Flow of Funds data (released yesterday) and the BEA supplement data on single family structure investment. This is an aggregate number, and is a combination of homeowners extracting equity - hence the name "MEW" - and normal principal payments and debt cancellation (modifications, short sales, and foreclosures).
For Q3 2017, the Net Equity Extraction was a positive $33 billion, or a positive 0.9% of Disposable Personal Income (DPI) .

This graph shows the net equity extraction, or mortgage equity withdrawal (MEW), results, using the Flow of Funds (and BEA data) compared to the Kennedy-Greenspan method.
Note: This data is impacted by debt cancellation and foreclosures, but much less than a few years ago.
MEW has been positive for 6 consecutive quarters, and 8 of the last 9 quarters. With a slower rate of debt cancellation, MEW will likely be mostly positive going forward.
The Fed's Flow of Funds report showed that the amount of mortgage debt outstanding increased by $85 billion in Q3.
The Flow of Funds report also showed that Mortgage debt has declined by $0.7 trillion since the peak. This decline is mostly because of debt cancellation per foreclosures and short sales, and some from modifications. There has also been some reduction in mortgage debt as homeowners paid down their mortgages so they could refinance.
For reference:
Dr. James Kennedy also has a simple method for calculating equity extraction: "A Simple Method for Estimating Gross Equity Extracted from Housing Wealth". Here is a companion spread sheet (the above uses my simple method).
For those interested in the last Kennedy data included in the graph, the spreadsheet from the Fed is available here.
Goldman expects "Tax Reform" to be Enacted in the "Next Two Weeks"
by Calculated Risk on 12/12/2017 11:27:00 AM
A few excerpts from an article by Goldman Sachs economist Alec Phillips:
We continue to expect tax reform to be enacted in the next two weeks. A House-Senate agreement looks likely by the end of this week or over the weekend, with votes on a final package by next week.
A 20% corporate rate continues to look likely, in our view, but we do not expect the cut to take effect until 2019. ...
The estimated revenue gain from limiting state and local tax (SALT) deductibility could be overstated if states adapt to the new restrictions. It is difficult to predict how and when states will adapt to the changes, but they have an incentive to do so.
NFIB: Small Business Optimism Index "Near All-Time High" in November
by Calculated Risk on 12/12/2017 08:35:00 AM
From the National Federation of Independent Business (NFIB): Small Business Optimism Hits Near All-Time High
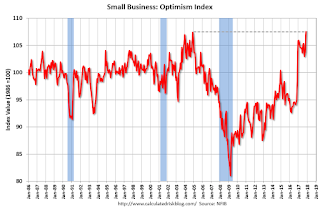
The Index of Small Business Optimism gained 3.7 points to 107.5 in November, the second highest reading in the 44-year history of the NFIB surveys (108.0 in July 1983). Eight of the 10 Index components posted a gain and two declined, as Job Openings fell from its record high level and Capital Spending Plans declined 1 point.
After several solid quarters, job creation slowed in the small business sector as business owners reported a seasonally adjusted average employment change per firm of 0.0 workers.
emphasis added
 Click on graph for larger image.
This graph shows the small business optimism index since 1986.
The index increased to 107.5 in November.
Monday, December 11, 2017
Tuesday: Small Business Index, PPI
by Calculated Risk on 12/11/2017 06:59:00 PM
From Matthew Graham at Mortgage News Daily: Mortgage Rates Unchanged to Slightly Higher
Mortgage rates moved modestly higher for the 3rd straight business day, making for a moderate correction from the last Wednesday's 1-month lows. In the recent context, talking about "1-month lows" and 3-day losing streaks is actually far too dramatic when it comes to the actual movement in rates. Most prospective borrowers would be seeing the same rates as last week with the only differences being a slight adjustment in the upfront costs. Even then, many lenders are perfectly unchanged over the past 2 days. Point being: rate volatility has been calm with few exceptions. [30YR FIXED - 4.0%].Tuesday:
• At 6:00 AM ET, NFIB Small Business Optimism Index for November.
• At 8:30 AM, The Producer Price Index for November from the BLS. The consensus is a 0.3% increase in PPI, and a 0.2% increase in core PPI.
Prime Working-Age Population nears 2007 Peak
by Calculated Risk on 12/11/2017 03:51:00 PM
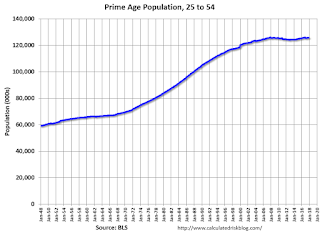
Update through November: The prime working age population peaked in 2007, and bottomed at the end of 2012. As of November 2017, according to the BLS, there were still fewer people in the 25 to 54 age group than in 2007.
At the beginning of this year - based on demographics - it looked like the prime working age (25 to 54) would probably hit a new peak in 2017. However, since the end of last year, the prime working age population has declined slightly (probably due to annual adjustment).
Changes in demographics are an important determinant of economic growth, and although most people focus on the aging of the "baby boomer" generation, the movement of younger cohorts into the prime working age is another key story. Here is a graph of the prime working age population (25 to 54 years old) from 1948 through November 2017.
Note: This is population, not work force.

There was a huge surge in the prime working age population in the '70s, '80s and '90s.
The prime working age labor force grew even quicker than the population in the '70s and '80s due to the increase in participation of women. In fact, the prime working age labor force was increasing 3%+ per year in the '80s!
So when we compare economic growth to the '70s, '80, or 90's we have to remember this difference in demographics (the '60s saw solid economic growth as near-prime age groups increased sharply).
The good news is the prime working age group should start growing at 0.5% per year - and this should boost economic activity.
Duy: "Expect the Fed to Stand By Its 2018 Outlook"
by Calculated Risk on 12/11/2017 03:15:00 PM
From Tim Duy at Bloomberg: Expect the Fed to Stand By Its 2018 Outlook. A few excerpts:
The Fed is likely to continue to point toward another 75 basis points of tightening in 2018 when it releases the next Summary of Economic Projections. To be sure, the minutes of the last FOMC meeting painted a dovish outlook as participants fretted about the inflation picture. But these concerns need to be weighed against the outlook for growth, which improved throughout 2017, and the implications of that accelerated growth on unemployment.
...
I anticipate the Fed will largely retain the policy rate forecast for 2018. This may come as a surprise given the dovish Fed minutes, but the recent surge in short-term rates indicates that financial markets are waking up to the reality that solid economic growth will prompt the bank to keep hiking rates despite low inflation. All else equal, the stage will be set for an inversion of the yield curve by the end of next year.


