by Calculated Risk on 1/05/2018 10:05:00 AM
Friday, January 05, 2018
ISM Non-Manufacturing Index decreased to 55.9% in December
The November ISM Non-manufacturing index was at 55.9%, down from 57.4% in November. The employment index increased in December to 56.3%, from 55.3%. Note: Above 50 indicates expansion, below 50 contraction.
From the Institute for Supply Management: December 2017 Non-Manufacturing ISM Report On Business®
Economic activity in the non-manufacturing sector grew in December for the 96th consecutive month, say the nation’s purchasing and supply executives in the latest Non-Manufacturing ISM® Report On Business®.
The report was issued today by Anthony Nieves, CPSM, C.P.M., A.P.P., CFPM, Chair of the Institute for Supply Management® (ISM®) Non-Manufacturing Business Survey Committee: "The NMI® registered 55.9 percent, which is 1.5 percentage points lower than the November reading of 57.4 percent. This represents continued growth in the non-manufacturing sector at a slower rate. The Non-Manufacturing Business Activity Index decreased to 57.3 percent, 4.1 percentage points lower than the November reading of 61.4 percent, reflecting growth for the 101st consecutive month, at a slower rate in December. The New Orders Index registered 54.3 percent, 4.4 percentage points lower than the reading of 58.7 percent in November. The Employment Index increased 1 percentage point in December to 56.3 percent from the November reading of 55.3 percent. The Prices Index increased by 0.1 percentage point from the November reading of 60.7 percent to 60.8 percent, indicating that prices increased in December for the seventh consecutive month. According to the NMI®, 14 non-manufacturing industries reported growth. There has been a second consecutive month of pullback in the rate of growth. Overall, the majority of respondents’ comments indicate that they finished the year on a positive note. They also indicate optimism for business conditions and the economic outlook going forward."
emphasis added
 Click on graph for larger image.
This graph shows the ISM non-manufacturing index (started in January 2008) and the ISM non-manufacturing employment diffusion index.
This suggests slower expansion in December than in November.
Comments on December Employment Report
by Calculated Risk on 1/05/2018 08:49:00 AM
The headline jobs number was below consensus expectations at 148 thousand, probably somewhat due to weather (snow) during the reference week in December (Weather was the reason I took the "under"). The previous two months were revised down slightly by a combined 9 thousand jobs.
Earlier: December Employment Report: 148,000 Jobs Added, 4.1% Unemployment Rate
In December, the year-over-year change was 2.055 million jobs. This is still generally trending down.
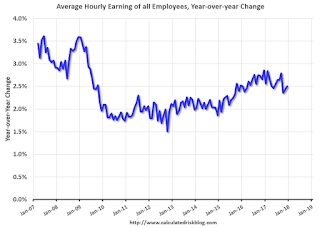
Average Hourly Earnings

This graph is based on “Average Hourly Earnings” from the Current Employment Statistics (CES) (aka "Establishment") monthly employment report. Note: There are also two quarterly sources for earnings data: 1) “Hourly Compensation,” from the BLS’s Productivity and Costs; and 2) the Employment Cost Index which includes wage/salary and benefit compensation.
The graph shows the nominal year-over-year change in "Average Hourly Earnings" for all private employees. Nominal wage growth was at 2.5% YoY in December.
Wage growth had been trending up, although the acceleration in wage growth slowed in 2017.
Part Time for Economic Reasons

The number of persons employed part time for economic reasons (sometimes referred to as involuntary part-time workers) was essentially unchanged at 4.9 million in December but was down by 639,000 over the year. These individuals, who would have preferred full-time employment, were working part time because their hours had been cut back or because they were unable to find a full-time job.The number of persons working part time for economic reasons increased slightly in December. The number working part time for economic reasons suggests a little slack still in the labor market.
These workers are included in the alternate measure of labor underutilization (U-6) that increased to 8.1% in December.
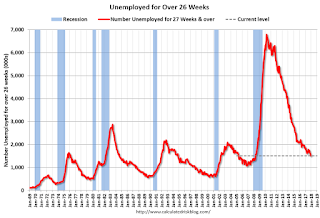
Unemployed over 26 Weeks
 This graph shows the number of workers unemployed for 27 weeks or more.
 According to the BLS, there are 1.52 million workers who have been unemployed for more than 26 weeks and still want a job. This was down from 1.59 million in November
This is the lowest level since April 2008.
This is trending down, but still a little elevated.
The headline jobs number was a little disappointing and the unemployment rate unchanged at a low level - but overall a continuation of multi-year trends. Wage growth was disappointing again.
December Employment Report: 148,000 Jobs Added, 4.1% Unemployment Rate
by Calculated Risk on 1/05/2018 08:42:00 AM
From the BLS:
Total nonfarm payroll employment increased by 148,000 in December, and the unemployment rate was unchanged at 4.1 percent, the U.S. Bureau of Labor Statistics reported today. Employment gains occurred in health care, construction, and manufacturing.
...
The change in total nonfarm payroll employment for October was revised down from +244,000 to +211,000, and the change for November was revised up from +228,000 to +252,000. With these revisions, employment gains in October and November combined were 9,000 less than previously reported.
...
In December, average hourly earnings for all employees on private nonfarm payrolls rose by 9 cents to $26.63. Over the year, average hourly earnings have risen by 65 cents, or 2.5 percent.
emphasis added
 Click on graph for larger image.
The first graph shows the monthly change in payroll jobs, ex-Census (meaning the impact of the decennial Census temporary hires and layoffs is removed - mostly in 2010 - to show the underlying payroll changes).
Total payrolls increased by 148 thousand in December (private payrolls increased 146 thousand).
Payrolls for October and November were revised down by a combined 9 thousand.
 This graph shows the year-over-year change in total non-farm employment since 1968.
In December the year-over-year change was 2.055 million jobs.
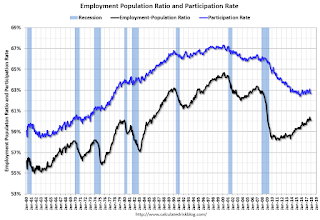
The third graph shows the employment population ratio and the participation rate.
 The Labor Force Participation Rate was unchanged in December at 62.7%. This is the percentage of the working age population in the labor force. A large portion of the recent decline in the participation rate is due to demographics.
 The Employment-Population ratio was unchanged at 60.1% (black line).
I'll post the 25 to 54 age group employment-population ratio graph later.
 The fourth graph shows the unemployment rate.
 The unemployment rate was unchanged in December at 4.1%.
This was below consensus expectations of 190,000 jobs, and the previous two months combined were revised down slightly.
I'll have much more later ...
Thursday, January 04, 2018
Friday: Employment Report, Trade Deficit
by Calculated Risk on 1/04/2018 07:23:00 PM
My December Employment Preview
Goldman: December Payrolls Preview
Friday:
• At 8:30 AM, Employment Report for December. The consensus is for an increase of 190,000 non-farm payroll jobs added in December, down from the 228,000 non-farm payroll jobs added in November. The consensus is for the unemployment rate to be unchanged at 4.1%.
• At 8:30 AM, Trade Balance report for November from the Census Bureau. The consensus is for the U.S. trade deficit to be at $48.3 billion in November from $48.7 billion in October.
• At 10:00 AM, the ISM non-Manufacturing Index for December. The consensus is for index to increase to 57.6 from 57.4 in November.
Final Update: 2018 Housing Forecasts
by Calculated Risk on 1/04/2018 05:11:00 PM
Towards the end of each year I collect some housing forecasts for the following year.
The table below shows several forecasts for 2018:
From Fannie Mae: Housing Forecast: December 2017
From Freddie Mac: November 2017 Economic & Housing Market Forecas
From NAHB: NAHB’s housing and economic forecast
From NAR: Economic & Housing Outlook
Note: For comparison, new home sales in 2017 will probably be around 615 thousand, and total housing starts around 1.210 million. House prices were up about 6.2% year-over-year in October (Case-Shiller).
| Housing Forecasts for 2018 | ||||
|---|---|---|---|---|
| New Home Sales (000s) | Single Family Starts (000s) | Total Starts (000s) | House Prices1 | |
| CoreLogic | 4.2%6 | |||
| Fannie Mae | 703 | 910 | 1,255 | 5.1%2 |
| Freddie Mac | 1,300 | 5.7%2 | ||
| HomeAdvisor5 | 653 | 981 | 1,320 | 4.0% |
| Merrill Lynch | 680 | 1,275 | 5.4% | |
| NAHB | 653 | 893 | 1,248 | |
| NAR | 700 | 5.0%3 | ||
| Wells Fargo | 675 | 930 | 1,280 | 5.3% |
| Zillow | 3.0%4 | |||
| 1Case-Shiller unless indicated otherwise 2FHFA Purchase-Only Index 3NAR Median Prices 4Zillow Home Prices 5Brad Hunter, chief economist, formerly of MetroStudy 6CoreLogic Index |
||||
Goldman: December Payrolls Preview
by Calculated Risk on 1/04/2018 02:05:00 PM
A few brief excerpts from a note by Goldman Sachs economist Spencer Hill:
We estimate that nonfarm payrolls increased 175k in December, somewhat below consensus of +190k. While labor market fundamentals appear solid, we expect a deceleration from the pace of job gains in October and November, which benefitted from a sharp employment rebound in hurricane-affected states. Our forecast also reflects a modest drag from winter storms around the December survey period.
We forecast a one-tenth decline in the unemployment rate to 4.0% ...We estimate average hourly earnings increased 0.3% month-over-month gain and 2.5% year-over-year ...
emphasis added
December Employment Preview
by Calculated Risk on 1/04/2018 11:59:00 AM
On Friday at 8:30 AM ET, the BLS will release the employment report for December. The consensus, according to Bloomberg, is for an increase of 190,000 non-farm payroll jobs in December (with a range of estimates between 160,000 to 210,000), and for the unemployment rate to be unchanged at 4.1%.
The BLS reported 228,000 jobs added in November.
First, on the weather in December from Chicago Fed economist Francois Gourio
"Perhaps surprisingly, December as a whole wasn't colder than usual for the US, but it was significantly more snowy. Our models imply that December NFP (to be released on Friday) will be affected negatively to the tune of 0.04-0.13ppt or 50k-170k jobs."Here is a summary of recent data:
• The ADP employment report showed an increase of 250,000 private sector payroll jobs in December. This was well above consensus expectations of 185,000 private sector payroll jobs added. The ADP report hasn't been very useful in predicting the BLS report for any one month, but in general, this suggests employment growth above expectations.
• The ISM manufacturing employment index decreased in December to 57.0%. A historical correlation between the ISM manufacturing employment index and the BLS employment report for manufacturing, suggests that private sector BLS manufacturing payroll increased about 20,000 in December. The ADP report indicated manufacturing jobs increased 9,000 in December.
The ISM non-manufacturing employment index will be released on Friday.
• Initial weekly unemployment claims averaged 241,750 in December, about the same as in November. For the BLS reference week (includes the 12th of the month), initial claims were at 245,000, up from 240,000 during the reference week in November.
The increase during the reference week suggests a slightly weaker employment report in December than in November.
• The final December University of Michigan consumer sentiment index decreased to 95.5 from the November reading of 98.5. Sentiment is frequently coincident with changes in the labor market, but there are other factors too like gasoline prices and politics.
• Conclusion: In general, these reports suggest a solid employment report. However, my guess, due to the probable weather impact, is the employment report will be below the consensus.
Reis: Mall Vacancy Rate unchanged in Q4 2017
by Calculated Risk on 1/04/2018 10:12:00 AM
Reis reported that the vacancy rate for regional malls was 8.3% in Q4 2017, unchanged from 8.3% in Q3, and up from 7.8% in Q4 2016. This is down from a cycle peak of 9.4% in Q3 2011.
For Neighborhood and Community malls (strip malls), the vacancy rate was 10.0% in Q4, unchanged from 10.0% in Q3, and up from 9.9% in Q4 2016. For strip malls, the vacancy rate peaked at 11.1% in Q3 2011.
Comments from Reis Economist Barbara Byrne Denham:
The retail real estate statistics camouflage the changes in the retail sector. Although the vacancy rate was flat for the quarter and the year, new tenants including grocery stores and gyms are taking space formerly occupied by bankrupt businesses such as Kmart. At the same time, some retail space is shutting down entirely or getting converted to other uses. Rent growth has been low but still positive throughout 2017.
New construction of 1.5 million square feet was the lowest level of completions since 2013. Net absorption of 1.9 million square feet was the highest since the first quarter. Asking rents increased 0.5% to $20.85 per square foot. This increase amounts to $0.10 per square foot. The effective rent increased 0.5% as concessions are not as significant in retail real estate as they are in the apartment market. Asking and effective rents have increased 1.8% and 1.9%, respectively, since the fourth quarter of 2016 and less than 4.0% since the end of 2015.
emphasis added
 Click on graph for larger image.
This graph shows the strip mall vacancy rate starting in 1980 (prior to 2000 the data is annual). The regional mall data starts in 2000. Back in the '80s, there was overbuilding in the mall sector even as the vacancy rate was rising. This was due to the very loose commercial lending that led to the S&L crisis.
In the mid-'00s, mall investment picked up as mall builders followed the "roof tops" of the residential boom (more loose lending). This led to the vacancy rate moving higher even before the recession started. Then there was a sharp increase in the vacancy rate during the recession and financial crisis.
Although unchanged in Q4, recently both the strip mall and regional mall vacancy rates have increased from an already elevated level.
Mall vacancy data courtesy of Reis.a>
Weekly Initial Unemployment Claims increase to 250,000
by Calculated Risk on 1/04/2018 08:36:00 AM
The DOL reported:
In the week ending December 30, the advance figure for seasonally adjusted initial claims was 250,000, an increase of 3,000 from the previous week's revised level. The previous week's level was revised up by 2,000 from 245,000 to 247,000. The 4-week moving average was 241,750, an increase of 3,500 from the previous week's revised average. The previous week's average was revised up by 500 from 237,750 to 238,250.The previous week was revised up.
Claims taking procedures continue to be disrupted in the Virgin Islands. The claims taking process in Puerto Rico has still not returned to normal.
emphasis added
The following graph shows the 4-week moving average of weekly claims since 1971.
 Click on graph for larger image.
The dashed line on the graph is the current 4-week average. The four-week average of weekly unemployment claims increased to 241,750.
This was higher than the consensus forecast. The low level of claims suggest relatively few layoffs.
ADP: Private Employment increased 250,000 in December
by Calculated Risk on 1/04/2018 08:20:00 AM
Private sector employment increased by 250,000 jobs from November to December according to the December ADP National Employment Report®. ... The report, which is derived from ADP’s actual payroll data, measures the change in total nonfarm private employment each month on a seasonally-adjusted basis.This was well above the consensus forecast for 185,000 private sector jobs added in the ADP report.
...
“We’ve seen yet another month where the labor market has shown no signs of slowing,” said Ahu Yildirmaz, vice president and co-head of the ADP Research Institute. “Throughout the year there was significant growth in services except for an overall loss of jobs in the shrinking information sector. Looking at company size, small businesses finished out 2017 on a high note adding more than double their monthly average for the past six months.”
Mark Zandi, chief economist of Moody’s Analytics, said, “The job market ended the year strongly. Robust Christmas sales prompted retailers and delivery services to add to their payrolls. The tight labor market will get even tighter, raising the specter that it will overheat.”
The BLS report for December will be released Friday, and the consensus is for 190,000 non-farm payroll jobs added in December.


