by Calculated Risk on 2/15/2018 02:35:00 PM
Thursday, February 15, 2018
Fannie and Freddie: REO inventory declined in Q4, Down 30% Year-over-year
Fannie and Freddie reported results this week. Here is some information on Real Estate Owned (REOs).
Freddie Mac reported the number of REO declined to 8,299 at the end of Q4 2017 compared to 11,418 at the end of Q4 2016.
For Freddie, this is down 89% from the 74,897 peak number of REOs in Q3 2010. For Freddie, this is the lowest since at least 2007.
Fannie Mae reported the number of REO declined to 26,311 at the end of Q4 2017 compared to 38,093 at the end of Q4 2016.
For Fannie, this is down 84% from the 166,787 peak number of REOs in Q3 2010. For Fannie, this is the lowest since at least 2007.
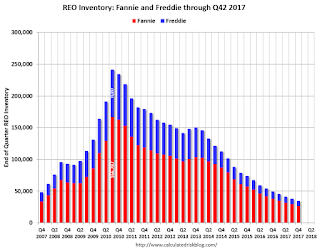
Here is a graph of Fannie and Freddie Real Estate Owned (REO).
REO inventory decreased in Q4 for both Fannie and Freddie, and combined inventory is down 30% year-over-year.
There are still a number of properties in the foreclosure process with long time lines in judicial foreclosure states - but this is close to normal levels of REOs.
Earlier: Philly and NY Fed Manufacturing Surveys Showed Growth in February
by Calculated Risk on 2/15/2018 11:59:00 AM
Earlier from the NY Fed: Empire State Manufacturing Survey
Business activity continued to expand in New York State, according to firms responding to the February 2018 Empire State Manufacturing Survey. The headline general business conditions index fell five points to 13.1, suggesting a somewhat slower pace of growth than in January. ... Labor market conditions pointed to a modest increase in employment and hours worked.And from the Philly Fed: February 2018 Manufacturing Business Outlook Survey
Results from the Manufacturing Business Outlook Survey suggest that the region’s manufacturing sector continues to expand in February. ... The index for current manufacturing activity increased 4 points in February to a reading of 25.8. ... The survey’s indicators for labor market conditions suggest a pickup in hiring this month. Over 30 percent of the firms reported increases in employment this month, up from 24 percent in January. The employment index increased 8 points. The firms also reported overall higher average work hours in February, although the workweek index fell 3 points to 13.7.Here is a graph comparing the regional Fed surveys and the ISM manufacturing index:
emphasis added
 Click on graph for larger image.
The New York and Philly Fed surveys are averaged together (yellow, through February), and five Fed surveys are averaged (blue, through January) including New York, Philly, Richmond, Dallas and Kansas City. The Institute for Supply Management (ISM) PMI (red) is through January (right axis).
This suggests the ISM manufacturing index night decrease slightly in February, but still show solid expansion again.
NAHB: Builder Confidence unchanged at 72 in February
by Calculated Risk on 2/15/2018 10:09:00 AM
The National Association of Home Builders (NAHB) reported the housing market index (HMI) was at 72 in February, unchanged from 72 in January. Any number above 50 indicates that more builders view sales conditions as good than poor.
From NAHB: Builder Confidence Stays at Strong Level in February
Builder confidence in the market for newly-built single-family homes remained unchanged at a healthy 72 level in February on the National Association of Home Builders/Wells Fargo Housing Market Index (HMI).
“Builders are excited about the pro-business political climate that will strengthen the housing market and support overall economic growth,” said NAHB Chairman Randy Noel, a custom home builder from LaPlace, La. “However, they need to manage supply-side construction hurdles, such as shortages of labor and lots and building material price increases.”
“The HMI gauge of future sales expectations has reached a post-recession high, an indicator that consumer demand for housing should grow in the months ahead,” said NAHB Chief Economist Robert Dietz. “With ongoing job creation, increasing owner-occupied household formation, and a tight supply of existing home inventory, the single-family housing sector should continue to strengthen at a gradual but consistent pace.”
...
The HMI component charting sales expectations in the next six months rose two points to 80, the index measuring buyer traffic held steady at 54, and the component gauging current sales conditions dropped one point to 78.
Looking at the three-month moving averages for regional HMI scores, the Midwest rose two points to 72, the South increased one point to 74, the West remained unchanged at 81, and Northeast fell two points to 56.
emphasis added
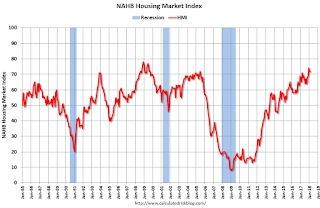 Click on graph for larger image.
This graph show the NAHB index since Jan 1985.
This was at the consensus forecast, and another strong reading.
Industrial Production Decreased 0.1% in January
by Calculated Risk on 2/15/2018 09:31:00 AM
From the Fed: Industrial Production and Capacity Utilization
Industrial production edged down 0.1 percent in January following four consecutive monthly increases. Manufacturing production was unchanged in January. Mining output fell 1.0 percent, with all of its major component industries recording declines, while the index for utilities moved up 0.6 percent. At 107.2 percent of its 2012 average, total industrial production was 3.7 percent higher in January than it was a year earlier. Capacity utilization for the industrial sector fell 0.2 percentage point in January to 77.5 percent, a rate that is 2.3 percentage points below its long-run (1972–2017) average.
 Click on graph for larger image.
This graph shows Capacity Utilization. This series is up 11.2 percentage points from the record low set in June 2009 (the series starts in 1967).
Capacity utilization at 77.5% is 2.3% below the average from 1972 to 2015 and below the pre-recession level of 80.8% in December 2007.
Note: y-axis doesn't start at zero to better show the change.
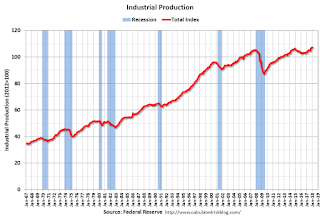 The second graph shows industrial production since 1967.
Industrial production decreased in January to 107.2. This is 23% above the recession low, and 2% above the pre-recession peak.
Weekly Initial Unemployment Claims increase to 230,000
by Calculated Risk on 2/15/2018 08:33:00 AM
The DOL reported:
In the week ending February 10, the advance figure for seasonally adjusted initial claims was 230,000, an increase of 7,000 from the previous week's revised level. The previous week's level was revised up by 2,000 from 221,000 to 223,000. The 4-week moving average was 228,500, an increase of 3,500 from the previous week's revised average. The previous week's average was revised up by 500 from 224,500 to 225,000.The previous week was revised up.
Claims taking procedures in Puerto Rico and in the Virgin Islands have still not returned to normal.
emphasis added
The following graph shows the 4-week moving average of weekly claims since 1971.
 Click on graph for larger image.
The dashed line on the graph is the current 4-week average. The four-week average of weekly unemployment claims increased to 228,500.
This was close to the consensus forecast. The low level of claims suggest relatively few layoffs.
Wednesday, February 14, 2018
Thursday: Unemployment Claims, PPI, NY and Philly Fed Mfg, Industrial Production, Homebuilder Confidence
by Calculated Risk on 2/14/2018 07:29:00 PM
From Matthew Graham at Mortgage News Daily: Things Just Keep Getting Worse For Mortgage Rates
Mortgage rates surged higher today, moving easily to new 4-year highs. Today's average conventional 30yr fixed rate is roughly one eighth of a percentage point higher than Wednesday of last week and more than half a point higher than the best rates seen in January. [30YR FIXED - 4.625%]Thursday:
emphasis added
• At 8:30 AM ET, The initial weekly unemployment claims report will be released. The consensus is for 229 thousand initial claims, up from 221 thousand the previous week.
• Also at 8:30 AM, the Philly Fed manufacturing survey for February. The consensus is for a reading of 21.5, down from 22.2.
• Also at 8:30 AM, The Producer Price Index for January from the BLS. The consensus is a 0.4% increase in PPI, and a 0.2% increase in core PPI.
• Also at 8:30 AM, The New York Fed Empire State manufacturing survey for February. The consensus is for a reading of 17.5, down from 17.7.
• At 9:15 AM, The Fed will release Industrial Production and Capacity Utilization for January. The consensus is for a 0.2% increase in Industrial Production, and for Capacity Utilization to increase to 78.0%.
• At 10:00 AM, The February NAHB homebuilder survey. The consensus is for a reading of 72, unchanged from 72 in January. Any number above 50 indicates that more builders view sales conditions as good than poor.
LA area Port Traffic Increases YoY in January
by Calculated Risk on 2/14/2018 05:02:00 PM
Container traffic gives us an idea about the volume of goods being exported and imported - and usually some hints about the trade report since LA area ports handle about 40% of the nation's container port traffic.
The following graphs are for inbound and outbound traffic at the ports of Los Angeles and Long Beach in TEUs (TEUs: 20-foot equivalent units or 20-foot-long cargo container).
To remove the strong seasonal component for inbound traffic, the first graph shows the rolling 12 month average.
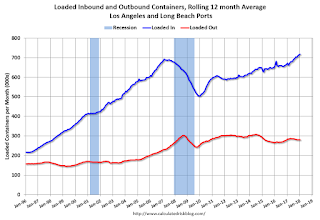
On a rolling 12 month basis, inbound traffic was up 0.4% compared to the rolling 12 months ending in December. Outbound traffic was down 0.3% compared to the rolling 12 months ending in December.
The 2nd graph is the monthly data (with a strong seasonal pattern for imports).

Trade has been strong - especially inbound - and setting record volumes most months recently.
In general imports have been increasing, and exports are mostly moving sideways to slightly down recently.
Key Measures Show Inflation Increased in January
by Calculated Risk on 2/14/2018 11:12:00 AM
The Cleveland Fed released the median CPI and the trimmed-mean CPI this morning:
According to the Federal Reserve Bank of Cleveland, the median Consumer Price Index rose 0.3% (4.2% annualized rate) in January. The 16% trimmed-mean Consumer Price Index also rose 0.3% (3.5% annualized rate) during the month. The median CPI and 16% trimmed-mean CPI are measures of core inflation calculated by the Federal Reserve Bank of Cleveland based on data released in the Bureau of Labor Statistics' (BLS) monthly CPI report.Note: The Cleveland Fed released the median CPI details for January here. Motor fuel was up sharply in January.
Earlier today, the BLS reported that the seasonally adjusted CPI for all urban consumers rose 0.5% (6.7% annualized rate) in January. The CPI less food and energy rose 0.3% (4.3% annualized rate) on a seasonally adjusted basis.
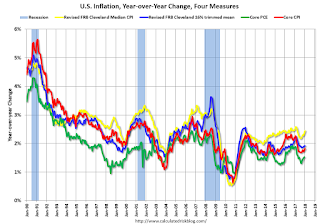 Click on graph for larger image.
This graph shows the year-over-year change for these four key measures of inflation. On a year-over-year basis, the median CPI rose 2.4%, the trimmed-mean CPI rose 1.9%, and the CPI less food and energy rose 1.8%. Core PCE is for December and increased 1.5% year-over-year.
On a monthly basis, median CPI was at 4.2% annualized, trimmed-mean CPI was at 3.5% annualized, and core CPI was at 4.3% annualized.
Using these measures, inflation picked up a little year-over-year in January. Overall, these measures are close, but still mostly below, the Fed's 2% target (Median CPI is slightly above).
Retail Sales decreased 0.3% in January
by Calculated Risk on 2/14/2018 08:41:00 AM
On a monthly basis, retail sales decreased 0.3 percent from December to January (seasonally adjusted), and sales were up 3.6 percent from January 2017.
From the Census Bureau report:
Advance estimates of U.S. retail and food services sales for January 2018, adjusted for seasonal variation and holiday and trading-day differences, but not for price changes, were $492.0 billion, a decrease of 0.3 percent from the previous month, but 3.6 percent above January 2017. ... The November 2017 to December 2017 percent change was revised from up 0.4 percent to virtually unchanged.
 Click on graph for larger image.
This graph shows retail sales since 1992. This is monthly retail sales and food service, seasonally adjusted (total and ex-gasoline).
Retail sales ex-gasoline were down 0.4% in January.
The second graph shows the year-over-year change in retail sales and food service (ex-gasoline) since 1993.
 Retail and Food service sales, ex-gasoline, increased by 3.5% on a YoY basis.
The increase in January was well below expectations, and sales in November and December were revised down sharply. A disappointing report.
MBA: Mortgage Applications Decrease in Latest Weekly Survey
by Calculated Risk on 2/14/2018 07:00:00 AM
From the MBA: Mortgage Applications Decrease in Latest MBA Weekly Survey
Mortgage applications decreased 4.1 percent from one week earlier, according to data from the Mortgage Bankers Association’s (MBA) Weekly Mortgage Applications Survey for the week ending February 9, 2018.
... The Refinance Index decreased 2 percent from the previous week. The seasonally adjusted Purchase Index decreased 6 percent from one week earlier. The unadjusted Purchase Index decreased 3 percent compared with the previous week and was 4 percent higher than the same week one year ago. ...
The average contract interest rate for 30-year fixed-rate mortgages with conforming loan balances ($453,100 or less) increased to its highest rate since January 2014, 4.57 percent, from 4.50 percent, with points increasing to 0.59 from 0.57 (including the origination fee) for 80 percent loan-to-value ratio (LTV) loans.
emphasis added
 Click on graph for larger image.
The first graph shows the refinance index since 1990.
Refinance activity will not pick up significantly unless mortgage rates fall well below 4%.
 The second graph shows the MBA mortgage purchase index
 According to the MBA, purchase activity is up 4% year-over-year.


