by Calculated Risk on 2/28/2018 07:00:00 AM
Wednesday, February 28, 2018
MBA: Mortgage Applications Increase in Latest Weekly Survey
From the MBA: Mortgage Applications Increase in Latest MBA Weekly Survey
Mortgage applications increased 2.7 percent from one week earlier, according to data from the Mortgage Bankers Association’s (MBA) Weekly Mortgage Applications Survey for the week ending February 23, 2018. This week’s results include an adjustment for the Washington's Birthday (Presidents’ Day) holiday.
... The Refinance Index decreased 1 percent from the previous week. The seasonally adjusted Purchase Index increased 6 percent from one week earlier. The unadjusted Purchase Index decreased 1 percent compared with the previous week and was 3 percent higher than the same week one year ago. ...
The average contract interest rate for 30-year fixed-rate mortgages with conforming loan balances ($453,100 or less) remained unchanged from last week at 4.64 percent, with points increasing to 0.63 from 0.61 (including the origination fee) for 80 percent loan-to-value ratio (LTV) loans.
emphasis added
 Click on graph for larger image.
The first graph shows the refinance index since 1990.
Refinance activity will not pick up significantly unless mortgage rates fall 50 bps or more from the recent level.
 The second graph shows the MBA mortgage purchase index
 According to the MBA, purchase activity is up 3% year-over-year.
Tuesday, February 27, 2018
Wednesday: GDP, Pending Home Sales, Chicago PMI
by Calculated Risk on 2/27/2018 07:35:00 PM
Wednesday:
• At 7:00 AM ET, The Mortgage Bankers Association (MBA) will release the results for the mortgage purchase applications index.
• At 8:30 AM, Gross Domestic Product, 4th quarter 2017 (Second estimate). The consensus is that real GDP increased 2.5% annualized in Q4, down from the advance estimate of 2.6%.
• 9:45 AM: Chicago Purchasing Managers Index for February. The consensus is for a reading of 65.0, down from 65.7 in January.
• At 10:00 AM, Pending Home Sales Index for January. The consensus is for a 0.5% increase in the index.
Freddie Mac: Mortgage Serious Delinquency Rate Decreased Slightly in January
by Calculated Risk on 2/27/2018 04:47:00 PM
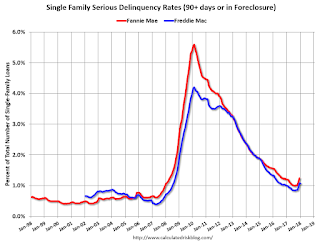
Freddie Mac reported that the Single-Family serious delinquency rate in January was 1.07%, down from 1.08% in December. Freddie's rate is up from 0.99% in January 2017.
Freddie's serious delinquency rate peaked in February 2010 at 4.20%.
These are mortgage loans that are "three monthly payments or more past due or in foreclosure".

The recent increase in the delinquency rate was due to the hurricanes - no worries about the overall market (These are serious delinquencies, so it took three months late to be counted).
After the hurricane bump, maybe the rate will decline to a cycle bottom in the 0.5% to 0.8% range.
Note: Fannie Mae will report for January soon.
Update: A few comments on the Seasonal Pattern for House Prices
by Calculated Risk on 2/27/2018 03:20:00 PM
CR Note: This is a repeat of earlier posts with updated graphs.
A few key points:
1) There is a clear seasonal pattern for house prices.
2) The surge in distressed sales during the housing bust distorted the seasonal pattern.
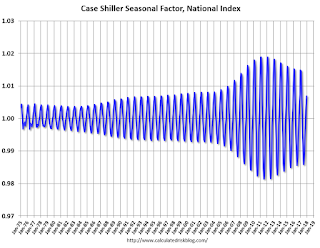
3) Even though distressed sales are down significantly, the seasonal factor is based on several years of data - and the factor is now overstating the seasonal change (second graph below).
4) Still the seasonal index is probably a better indicator of actual price movements than the Not Seasonally Adjusted (NSA) index.
For in depth description of these issues, see former Trulia chief economist Jed Kolko's article "Let’s Improve, Not Ignore, Seasonal Adjustment of Housing Data"
Note: I was one of several people to question the change in the seasonal factor (here is a post in 2009) - and this led to S&P Case-Shiller questioning the seasonal factor too (from April 2010). I still use the seasonal factor (I think it is better than using the NSA data).

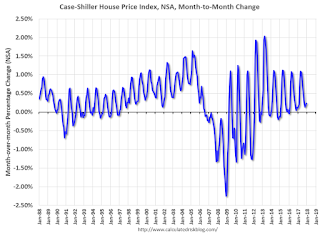
This graph shows the month-to-month change in the NSA Case-Shiller National index since 1987 (through November 2017). The seasonal pattern was smaller back in the '90s and early '00s, and increased once the bubble burst.
The seasonal swings have declined since the bubble.

The swings in the seasonal factors has started to decrease, and I expect that over the next several years - as the percent of distressed sales declines further and recent history is included in the factors - the seasonal factors will move back towards more normal levels.
However, as Kolko noted, there will be a lag with the seasonal factor since it is based on several years of recent data.
Real House Prices and Price-to-Rent Ratio in December
by Calculated Risk on 2/27/2018 12:50:00 PM
Here is the earlier post on Case-Shiller: Case-Shiller: National House Price Index increased 6.3% year-over-year in December
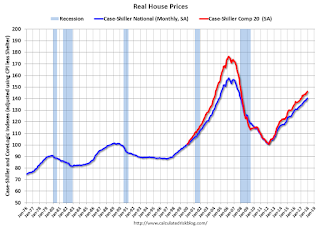
It has been more than ten years since the bubble peak. In the Case-Shiller release this morning, the seasonally adjusted National Index (SA), was reported as being 7.0% above the previous bubble peak. However, in real terms, the National index (SA) is still about 11.1% below the bubble peak (and historically there has been an upward slope to real house prices).
The year-over-year increase in prices is mostly moving sideways now around 6%. In December, the index was up 6.3% YoY.
Usually people graph nominal house prices, but it is also important to look at prices in real terms (inflation adjusted). Case-Shiller and others report nominal house prices. As an example, if a house price was $200,000 in January 2000, the price would be close to $282,000 today adjusted for inflation (41%). That is why the second graph below is important - this shows "real" prices (adjusted for inflation).
Nominal House Prices

In nominal terms, the Case-Shiller National index (SA) is at a new peak, and the Case-Shiller Composite 20 Index (SA) is back to March 2006 levels (and will probably be at a new high soon).
Real House Prices

In real terms, the National index is back to November 2004 levels, and the Composite 20 index is back to April 2004.
In real terms, house prices are back to 2004 levels.
Price-to-Rent
In October 2004, Fed economist John Krainer and researcher Chishen Wei wrote a Fed letter on price to rent ratios: House Prices and Fundamental Value. Kainer and Wei presented a price-to-rent ratio using the OFHEO house price index and the Owners' Equivalent Rent (OER) from the BLS.

This graph shows the price to rent ratio (January 2000 = 1.0).
On a price-to-rent basis, the Case-Shiller National index is back to January 2004 levels, and the Composite 20 index is back to October 2003 levels.
In real terms, prices are back to mid 2004 levels, and the price-to-rent ratio is back to late 2003, early 2004 - and the price-to-rent ratio has been increasing slowly.
Richmond Fed: District Manufacturing Firms Reported Robust Growth in February
by Calculated Risk on 2/27/2018 11:14:00 AM
From the Richmond Fed: Fifth District Manufacturing Firms Reported Robust Growth in February
Fifth District manufacturing firms saw robust growth in February, according to the results from the latest survey by the Federal Reserve Bank of Richmond. The composite manufacturing index jumped from 14 in January to 28 in February, the second highest value on record, driven by increases in shipments, orders, and employment. The wages index remained in positive territory at 23, while the available skills metric dropped from −10 in January to −17 in February. Despite greater difficulty finding skilled workers, District manufacturing firms saw strong growth in employment and the average workweek in February. Survey results show that manufacturers expect to see continued growth in the coming months.This was the last of the regional Fed surveys for February.
Manufacturing firms saw growth accelerate for both prices paid and prices received, with each increasing at the highest rate since April 2017. Firms expect prices to continue to grow at a faster rate in the near future.
emphasis added
Here is a graph comparing the regional Fed surveys and the ISM manufacturing index:
 Click on graph for larger image.
The New York and Philly Fed surveys are averaged together (yellow, through February), and five Fed surveys are averaged (blue, through February) including New York, Philly, Richmond, Dallas and Kansas City. The Institute for Supply Management (ISM) PMI (red) is through January (right axis).
Based on these regional surveys, it seems likely the ISM manufacturing index will be strong again in February (to be released Thursday, Mar 1st). The consensus is for the ISM to be at 58.6, down from 59.1 in January.
Powell: Semiannual Monetary Policy Report to the Congress
by Calculated Risk on 2/27/2018 09:51:00 AM
Excerpts from prepared statement from Fed Chair Jerome Powell: Semiannual Monetary Policy Report to the Congress
After easing substantially during 2017, financial conditions in the United States have reversed some of that easing. At this point, we do not see these developments as weighing heavily on the outlook for economic activity, the labor market, and inflation. Indeed, the economic outlook remains strong. The robust job market should continue to support growth in household incomes and consumer spending, solid economic growth among our trading partners should lead to further gains in U.S. exports, and upbeat business sentiment and strong sales growth will likely continue to boost business investment. Moreover, fiscal policy is becoming more stimulative. In this environment, we anticipate that inflation on a 12-month basis will move up this year and stabilize around the FOMC's 2 percent objective over the medium term. Wages should increase at a faster pace as well. The Committee views the near-term risks to the economic outlook as roughly balanced but will continue to monitor inflation developments closely.And on the balance sheet:
emphasis added
The Congress has assigned us the goals of promoting maximum employment and stable prices. Over the second half of 2017, the FOMC continued to gradually reduce monetary policy accommodation. Specifically, we raised the target range for the federal funds rate by 1/4 percentage point at our December meeting, bringing the target to a range of 1-1/4 to 1-1/2 percent. In addition, in October we initiated a balance sheet normalization program to gradually reduce the Federal Reserve's securities holdings. That program has been proceeding smoothly. These interest rate and balance sheet actions reflect the Committee's view that gradually reducing monetary policy accommodation will sustain a strong labor market while fostering a return of inflation to 2 percent.
Case-Shiller: National House Price Index increased 6.3% year-over-year in December
by Calculated Risk on 2/27/2018 09:16:00 AM
S&P/Case-Shiller released the monthly Home Price Indices for December ("December" is a 3 month average of October, November and December prices).
This release includes prices for 20 individual cities, two composite indices (for 10 cities and 20 cities) and the monthly National index.
Note: Case-Shiller reports Not Seasonally Adjusted (NSA), I use the SA data for the graphs.
From S&P: S&P CoreLogic Case-Shiller National Home Price Index Shows Home Prices End the Year 6.3% Higher than 2016
The S&P CoreLogic Case-Shiller U.S. National Home Price NSA Index, covering all nine U.S. census divisions, reported a 6.3% annual gain in December, up from 6.1% in the previous month. The 10-City Composite annual increase came in at 6.0%, no change from the previous month. The 20-City Composite posted a 6.3% year-over-year gain, down from 6.4% in the previous month.
Seattle, Las Vegas, and San Francisco reported the highest year-over-year gains among the 20 cities. In December, Seattle led the way with a 12.7% year-over-year price increase, followed by Las Vegas with an 11.1% increase, and San Francisco with a 9.2% increase. Nine cities reported greater price increases in the year ending December 2017 versus the year ending November 2017
...
Before seasonal adjustment, the National Index posted a month-over-month gain of 0.2% in December. The 10-City and 20-City Composites both reported increases of 0.2%. After seasonal adjustment, the National Index recorded a 0.7% month-over-month increase in December. The 10-City and 20-City Composites both posted 0.6% month-over-month increases. Twelve of the 20 cities reported increases in December before seasonal adjustment, while all 20 cities reported increases after seasonal adjustment.
“The rise in home prices should be causing the same nervous wonder aimed at the stock market after its recent bout of volatility,” says David M. Blitzer, Managing Director and Chairman of the Index Committee at S&P Dow Jones Indices. “Across the 20 cities covered by S&P Corelogic Case Shiller Home Price Indices, the average increase from the financial crisis low is 62%; over the same period, inflation was 12.4%. None of the cities covered in this release saw real, inflation-adjusted prices fall in 2017. The National Index, which reached its low point in 2012, is up 38% in six years after adjusting for inflation, a real annual gain of 5.3%. The National Index’s average annual real gain from 1976 to 2017 was 1.3%. Even considering the recovery from the financial crisis, we are experiencing a boom in home prices.
“Within the last few months, there are beginning to be some signs that gains in housing may be leveling off. Sales of existing homes fell in December and January after seasonal adjustment and are now as low as any month in 2017. Pending sales of existing homes are roughly flat over the last several months. New home sales appear to be following the same trend as existing home sales. While the price increases do not suggest any weakening of demand, mortgage rates rose from 4% to 4.4% since the start of the year. It is too early to tell if the housing recovery is slowing. If it is, some moderation in price gains could be seen later this year.”
emphasis added
 Click on graph for larger image.
 The first graph shows the nominal seasonally adjusted Composite 10, Composite 20 and National indices (the Composite 20 was started in January 2000).
The Composite 10 index is off 3.1% from the peak, and up 0.6% in December (SA).
The Composite 20 index is off slightly from the peak, and up 0.6% (SA) in December.
The National index is 7.0% above the bubble peak (SA), and up 0.7% (SA) in December. The National index is up 44.7% from the post-bubble low set in December 2011 (SA).
 The second graph shows the Year over year change in all three indices.
The Composite 10 SA is up 6.0% compared to December 2016. The Composite 20 SA is up 6.3% year-over-year.
The National index SA is up 6.3% year-over-year.
Note: According to the data, prices increased in all 20 of 20 cities month-over-month seasonally adjusted.
I'll have more later.
Monday, February 26, 2018
Tuesday: Case-Shiller, Fed Chair Powell
by Calculated Risk on 2/26/2018 07:23:00 PM
From Matthew Graham at Mortgage News Daily: Another 2018 First For Mortgage Rates
Mortgage rates fell for the third day in a row--the first time that's happened so far in 2018! Much like last week was slightly less spectacular than its "best in 2018" designation, today also comes with caveats. Even though rates technically did fall for the third straight day, most of the day was spent with underlying bond markets moving into weaker territory. This resulted in several lenders raising rates in the middle of the day, leaving them roughly in line with Friday's latest offerings. [30YR FIXED - 4.625%]Tuesday:
emphasis added
• At 8:30 AM ET, Durable Goods Orders for January from the Census Bureau. The consensus is for a 0.2% decrease in durable goods orders.
• At 9:00 AM, S&P/Case-Shiller House Price Index for December. The consensus is for a 6.3% year-over-year increase in the Comp 20 index for December.
• At 9:00 AM, FHFA House Price Index for December 2017. This was originally a GSE only repeat sales, however there is also an expanded index.
• At 10:00 AM, Fed Chair Jerome Powell Testimony, Semiannual Monetary Policy Report to the Congress, Before the House Financial Services Committee, Washington, D.C.
• At 10:00 AM, Richmond Fed Survey of Manufacturing Activity for February. This is the last of the regional surveys for February.
Housing Inventory Tracking
by Calculated Risk on 2/26/2018 04:05:00 PM
Update: Watching existing home "for sale" inventory is very helpful. As an example, the increase in inventory in late 2005 helped me call the top for housing.
And the decrease in inventory eventually helped me correctly call the bottom for house prices in early 2012, see: The Housing Bottom is Here.
And in 2015, it appeared the inventory build in several markets was ending, and that boosted price increases.
I don't have a crystal ball, but watching inventory helps understand the housing market.
The graph below shows the year-over-year change for non-contingent inventory in Las Vegas through January 2018, Phoenix and Sacramento, and also total existing home inventory as reported by the NAR (through January 2018).

This shows the year-over-year change in inventory for Phoenix, Sacramento, and Las Vegas. The black line if the year-over-year change in inventory as reported by the NAR.
Note that inventory is Sacramento was up 15% year-over-year in January (still very low), and has increased year-over-year for four consecutive months. However inventory is down Nationally, and down in Phoenix and Las Vegas.
I'll try to add a few other markets.
Inventory is a key for the housing market, and I will be watching inventory for the impact of the new tax law and higher mortgage rates on housing.


