by Calculated Risk on 5/01/2018 07:00:00 PM
Tuesday, May 01, 2018
Wednesday: FOMC Announcement, ADP Employment
From Tim Duy at Fed Watch: Set To Stay On Current Path
The Federal Open Market Committee begins their two-day meeting this morning, an effort that will almost certainly culminate with steady rates and fairly limited alterations to the accompanying FOMC statement. The underlying message is “steady as she goes.” We have yet to see data break meaningfully to either side of the Fed’s forecast such to expect a change in the pace of rate hikes. With the economic data continuing to support the broad contours of the Federal Reserve’s forecast, we should expect the Fed to remain on track to hike policy rates by 25bp each quarter for the remainder of this year.CR Note: At some point I expect the Fed to announce a press conference after every FOMC meeting.
Wednesday:
• At 7:00 AM ET, The Mortgage Bankers Association (MBA) will release the results for the mortgage purchase applications index.
• At 8:15 AM, The ADP Employment Report for April. This report is for private payrolls only (no government). The consensus is for 193,000 payroll jobs added in April, down from 241,000 added in March.
• At 2:00 PM, FOMC Meeting Announcement. The FOMC is expected to announce no change to policy at this meeting.
U.S. Light Vehicle Sales decrease to 17.15 million annual rate in April
by Calculated Risk on 5/01/2018 03:36:00 PM
Based on a preliminary estimate from AutoData, light vehicle sales were at a 17.15 million SAAR in April.
That is up 1% year-over-year from April 2017, and down 1.4% from last month.
Click on graph for larger image.
This graph shows the historical light vehicle sales from the BEA (blue) and an estimate for April (red, light vehicle sales of 17.15 million SAAR from AutoData).
This was slightly above the consensus forecast for April.
Note that the increase in sales at the end of 2017 was due to buying following the hurricanes.
Sales will probably move sideways or decline in 2018 after setting new sales records in both 2015 and 2016.

Note: dashed line is current estimated sales rate.
Q1 2018 GDP Details on Residential and Commercial Real Estate
by Calculated Risk on 5/01/2018 01:38:00 PM
The BEA has released the underlying details for the Q1 advance GDP report.
The BEA reported that investment in non-residential structures increased at a 12.3% annual pace in Q1. Investment in petroleum and natural gas exploration increased substantially recently, from a $55 billion annual rate in Q4 2016 to a $118 billion annual rate in Q1 2018 - but is still down from a recent peak of $165 billion in Q4 2014.
Without the increase in petroleum and natural gas exploration, non-residential investment would be essentially unchanged year-over-year.

The first graph shows investment in offices, malls and lodging as a percent of GDP.
Investment in offices increased in Q1, and is up 1% year-over-year.
Investment in multimerchandise shopping structures (malls) peaked in 2007 and was down slightly year-over-year in Q1. The vacancy rate for malls is still very high, so investment will probably stay low for some time.
Lodging investment increased in Q1, and lodging investment is up 14% year-over-year.

Home improvement was the top category for five consecutive years following the housing bust ... but now investment in single family structures has been back on top for the last four years and will probably stay there for a long time.
However - even though investment in single family structures has increased from the bottom - single family investment is still very low, and still below the bottom for previous recessions as a percent of GDP. I expect further increases over the next few years.
Investment in single family structures was $280 billion (SAAR) (about 1.4% of GDP), and was up in Q1 compared to Q4.
Investment in multi-family structures declined in Q1.
Investment in home improvement was at a $243 billion Seasonally Adjusted Annual Rate (SAAR) in Q1 (about 1.2% of GDP). Home improvement spending has been solid.
Construction Spending decreased 1.7% in March
by Calculated Risk on 5/01/2018 10:50:00 AM
Earlier today, the Census Bureau reported that overall construction spending decreased in March:
Construction spending during March 2018 was estimated at a seasonally adjusted annual rate of $1,284.7 billion, 1.7 percent below the revised February estimate of $1,306.4 billion. The March figure is 3.6 percent above the March 2017 estimate of $1,239.6 billion.Private spending decreased and public spending was essentially unchanged in March:
Spending on private construction was at a seasonally adjusted annual rate of $987.5 billion, 2.1 percent below the revised February estimate of $1,009.1 billion. ...
In March, the estimated seasonally adjusted annual rate of public construction spending was $297.2 billion, nearly the same as the revised February estimate of $297.3 billion.
emphasis added
 Click on graph for larger image.
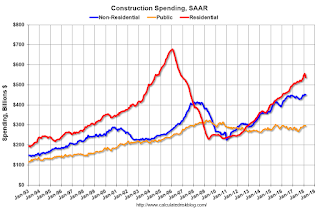
This graph shows private residential and nonresidential construction spending, and public spending, since 1993. Note: nominal dollars, not inflation adjusted.
Private residential spending has been increasing, but is still 21% below the bubble peak.
Non-residential spending is 9% above the previous peak in January 2008 (nominal dollars).
Public construction spending is now 9% below the peak in March 2009, and 13% above the austerity low in February 2014.
 The second graph shows the year-over-year change in construction spending.
On a year-over-year basis, private residential construction spending is up 5%. Non-residential spending is up 2% year-over-year. Public spending is up 3% year-over-year.
This was below the consensus forecast of a 0.5% increase for March, however spending for the previous two months was revised up.
ISM Manufacturing index decreased to 57.3 in April
by Calculated Risk on 5/01/2018 10:06:00 AM
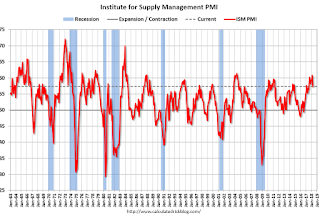
The ISM manufacturing index indicated expansion in April. The PMI was at 57.3% in April, down from 59.3% in March. The employment index was at 54.2%, down from 57.3% last month, and the new orders index was at 61.2%, down from 61.9%.
From the Institute for Supply Management: April 2018 Manufacturing ISM® Report On Business®
Economic activity in the manufacturing sector expanded in April, and the overall economy grew for the 108th consecutive month, say the nation’s supply executives in the latest Manufacturing ISM® Report On Business®.
The report was issued today by Timothy R. Fiore, CPSM, C.P.M., Chair of the Institute for Supply Management® (ISM®) Manufacturing Business Survey Committee: “The April PMI® registered 57.3 percent, a decrease of 2 percentage points from the March reading of 59.3 percent. The New Orders Index registered 61.2 percent, a decrease of 0.7 percentage point from the March reading of 61.9 percent. The Production Index registered 57.2 percent, a 3.8 percentage point decrease compared to the March reading of 61 percent. The Employment Index registered 54.2 percent, a decrease of 3.1 percentage points from the March reading of 57.3 percent. The Supplier Deliveries Index registered 61.1 percent, a 0.5 percentage point increase from the March reading of 60.6 percent. The Inventories Index registered 52.9 percent, a decrease of 2.6 percentage points from the March reading of 55.5 percent. The Prices Index registered 79.3 percent in April, a 1.2 percentage point increase from the March reading of 78.1 percent, indicating higher raw materials prices for the 26th consecutive month. Comments from the panel reflect continued expanding business strength. Demand remains strong, with the New Orders Index at 60 or above for the 12th straight month, and the Customers’ Inventories Index remaining at low levels. The Backlog of Orders Index continued expanding, with its highest reading since May 2004, when it registered 63 percent. Consumption, described as production and employment, continues to expand, but has been restrained by labor and skill shortages. Inputs, expressed as supplier deliveries, inventories and imports, declined overall, due primarily to inventory reductions likely led by supplier performance restrictions. Lead time extensions, steel and aluminum disruptions, supplier labor issues, and transportation difficulties continue. Export orders remained strong. The Prices Index is at its highest level since April 2011, when it registered 82.6 percent. In April, price increases occurred across 17 of 18 industry sectors. Demand remains robust, but the nation’s employment resources and supply chains continue to struggle.”
emphasis added
 Click on graph for larger image.
Here is a long term graph of the ISM manufacturing index.
This was below expectations of 58.7%, and suggests manufacturing expanded at a slower pace in April than in March.
Still a solid report.
CoreLogic: House Prices up 7.0% Year-over-year in March
by Calculated Risk on 5/01/2018 08:52:00 AM
Notes: This CoreLogic House Price Index report is for March. The recent Case-Shiller index release was for February. The CoreLogic HPI is a three month weighted average and is not seasonally adjusted (NSA).
From CoreLogic: CoreLogic Reports Home Prices Up Again in March, This Time by 7 Percent
CoreLogic® ... today released the CoreLogic Home Price Index (HPI™) and HPI Forecast™ for March 2018, which shows home prices rose both year over year and month over month. Home prices increased nationally by 7 percent year over year from March 2017 to March 2018, while on a month-over-month basis, prices increased by 1.4 percent in March 2018 – compared with February 2018 – according to the CoreLogic HPI.CR Note: The CoreLogic YoY increase has been in the 5% to 7% range for the last couple of years. This is towards the top end of that range. The year-over-year comparison has been positive for six consecutive years since turning positive year-over-year in February 2012.
Looking ahead, the CoreLogic HPI Forecast indicates that the national home-price index is projected to continue to increase by 5.2 percent on a year-over-year basis from March 2018 to March 2019. On a month-over-month basis, home prices are expected to rise 0.1 percent in April 2018. The CoreLogic HPI Forecast is a projection of home prices that is calculated using the CoreLogic HPI and other economic variables. Values are derived from state-level forecasts by weighting indices according to the number of owner-occupied households for each state.
“Home prices grew briskly in the first quarter of 2018,” said Dr. Frank Nothaft, chief economist for CoreLogic. “High demand and limited supply have pushed home prices above where they were in early 2006. New construction still lags historically normal levels, keeping upward pressure on prices.”
emphasis added
Monday, April 30, 2018
Tuesday: ISM Manufacturing, Construction Spending, Auto Sales
by Calculated Risk on 4/30/2018 07:52:00 PM
From Matthew Graham at Mortgage News Daily: Mortgage Rates Mostly Sideways to Begin Busy Week
Mortgage rates didn't move much today, which keeps them right in line with last week's lowest levels. That sounds pretty good! Unfortunately, any time prior to last week, those "lowest levels" would have been the highest in more than 4 years. [30YR FIXED - 4.625%-4.75%]Tuesday:
emphasis added
• At 10:00 AM ET, ISM Manufacturing Index for April. The consensus is for the ISM to be at 58.7, down from 59.3 in March. The PMI was at 59.3% in March, the employment index was at 57.3%, and the new orders index was at 61.9%.
• Also at 10:00 AM, Construction Spending for March. The consensus is for a 0.5% increase in construction spending.
• All day, Light vehicle sales for April. The consensus is for light vehicle sales to be 17.2 million SAAR in March, down from 17.4 million in March (Seasonally Adjusted Annual Rate).
Fannie Mae: Mortgage Serious Delinquency rate decreased in March
by Calculated Risk on 4/30/2018 04:21:00 PM
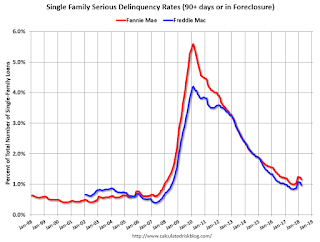
Fannie Mae reported that the Single-Family Serious Delinquency rate decreased to 1.16% in March, down from 1.22% in January. The serious delinquency rate is up from 1.12% in March 2017.
These are mortgage loans that are "three monthly payments or more past due or in foreclosure".
The Fannie Mae serious delinquency rate peaked in February 2010 at 5.59%.

By vintage, for loans made in 2004 or earlier (3% of portfolio), 3.24% are seriously delinquent. For loans made in 2005 through 2008 (6% of portfolio), 6.22% are seriously delinquent, For recent loans, originated in 2009 through 2018 (91% of portfolio), only 0.51% are seriously delinquent. So Fannie is still working through poor performing loans from the bubble years.
The recent increase in the delinquency rate was due to the hurricanes - no worries about the overall market (These are serious delinquencies, so it took three months late to be counted).
After the hurricane bump, the rate will probably decline to 0.5 to 0.7 percent or so to a cycle bottom.
Note: Freddie Mac reported earlier.
Energy expenditures as a percentage of PCE
by Calculated Risk on 4/30/2018 02:09:00 PM
Note: Back in early 2016, I noted that energy expenditures as a percentage of PCE had hit an all time low. Here is an update through the March 2018 PCE report released this morning.
Below is a graph of expenditures on energy goods and services as a percent of total personal consumption expenditures through March 2018.
This is one of the measures that Professor Hamilton at Econbrowser looks at to evaluate any drag on GDP from energy prices.
Click on graph for larger image.
Data source: BEA Table 2.3.5U.
The huge spikes in energy prices during the oil crisis of 1973 and 1979 are obvious. As is the increase in energy prices during the 2001 through 2008 period.
In March 2018, energy expenditures as a percentage of PCE increased to 4.05% of PCE, up from the all time low two years ago of 3.6%.
Historically this is still a low percentage of PCE for energy expenditures, even though oil prices are up sharply over the last two years (WTI was at $37.55 per barrel in March 2016 and has risen to almost $69 per barrel today).
Earlier: Chicago PMI Increased Slightly in April
by Calculated Risk on 4/30/2018 01:10:00 PM
From the Chicago PMI: Chicago Business Barometer Rises to 57.6 in April
The MNI Chicago Business Barometer rose 0.2 points to 57.6 in April, up from 57.4 in March, snapping a three-month downward trend.This was slightly below the consensus forecast of 57.8, but still a decent reading.
Business activity continued to rise at a solid pace in April, with growth in firms’ operations up for the first time this year, albeit marginally. Three of the five Barometer components fell on the month, with only Production and Supplier Deliveries finding room to grow.
...
“While the MNI Chicago Business Barometer ended a threemonth falling streak in April, supply constraints faced by firms intensified and continue to weigh on activity. Longer delivery times are proving attritive, while dearer materials bite further into margins” said Jamie Satchi, Economist at MNI Indicators.
“Uncertainty among suppliers appears to be assisting the upward march in prices, but the majority of firms were optimistic any negative impact stemming directly from recently implemented tariffs would be minimal,” he added.
emphasis added


