by Calculated Risk on 5/08/2018 01:50:00 PM
Tuesday, May 08, 2018
Update: Housing Inventory Tracking
Update: Watching existing home "for sale" inventory is very helpful. As an example, the increase in inventory in late 2005 helped me call the top for housing.
And the decrease in inventory eventually helped me correctly call the bottom for house prices in early 2012, see: The Housing Bottom is Here.
And in 2015, it appeared the inventory build in several markets was ending, and that boosted price increases.
I don't have a crystal ball, but watching inventory helps understand the housing market.
The graph below shows the year-over-year change for non-contingent inventory in Las Vegas (through April), Phoenix and Sacramento (through March), and also total existing home inventory as reported by the NAR (also through March 2018).

This shows the year-over-year change in inventory for Phoenix, Sacramento, and Las Vegas. The black line if the year-over-year change in inventory as reported by the NAR.
Note that inventory in Sacramento was up 19% year-over-year in March (inventory was still very low), and has increased year-over-year for six consecutive months.
Also note the inventory is still down 19.5% in Las Vegas (red), but the YoY decline has been getting smaller - and it is very possible that inventory will up year-over-year in Las Vegas later this year.
I'll try to add a few other markets.
Inventory is a key for the housing market, and I will be watching inventory for the impact of the new tax law and higher mortgage rates on housing.
Las Vegas Real Estate in April: Sales Up Slightly YoY, Inventory down 19%
by Calculated Risk on 5/08/2018 12:11:00 PM
This is a key distressed market to follow since Las Vegas saw the largest price decline, following the housing bubble, of any of the Case-Shiller composite 20 cities.
The Greater Las Vegas Association of Realtors reported Southern Nevada home prices keep climbing while supply keeps shrinking; GLVAR housing statistics for April 2018
Local home prices kept climbing through April as the local housing supply continued contracting, according to a report released today by the Greater Las Vegas Association of REALTORS®(GLVAR).1) Overall sales were up slightly year-over-year from 3,529 in April 2017 to 3,571 in April 2018.
...
The low supply may also be slowing down local home sales, which have been running roughly even with last year’s sales pace so far this year after increasing in recent years. The total number of existing local homes, condos and townhomes sold during April was 3,571. Compared to one year ago, April sales were up 0.4 percent for homes and up 4.5 percent for condos and townhomes.
...
By the end of April, GLVAR reported 3,816 single-family homes listed for sale without any sort of offer. That’s down 24.9 percent from one year ago. For condos and townhomes, the 790 properties listed without offers in April represented a 23.6 percent increase from one year ago.
...
Meanwhile, the number of so-called distressed sales continues to decline. GLVAR reported that short sales and foreclosures combined accounted for 2.5 percent of all existing local home sales in April, down from 8.4 percent of all sales one year ago.
emphasis added
2) Active inventory (single-family and condos) is down sharply from a year ago, from a total of 5,722 in April 2017 to 4,606 in April 2018. Note: Total inventory was down 19.5% year-over-year - a large decline - but the smallest year-over-year decline in inventory since November 2016.
Watch inventory. Last year, inventory declined almost 500 homes from March to April, this year inventory was up slightly from March to April. The inventory decline might be nearing an end in Las Vegas (and elsewhere).
3) Fewer distressed sales.
BLS: Job Openings Increased in March to New Series High
by Calculated Risk on 5/08/2018 10:07:00 AM
From the BLS: Job Openings and Labor Turnover Summary
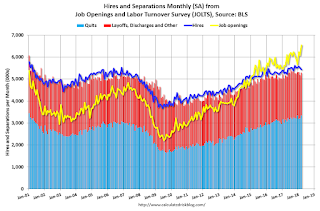
The number of job openings increased to 6.6 million on the last business day of March, the U.S. Bureau of Labor Statistics reported today. Over the month, hires and separations were little changed at 5.4 million and 5.3 million, respectively. Within separations, the quits rate was little changed at 2.3 percent and the layoffs and discharges rate was unchanged at 1.1 percent. ...The following graph shows job openings (yellow line), hires (dark blue), Layoff, Discharges and other (red column), and Quits (light blue column) from the JOLTS.
The number of quits edged up to 3.3 million in March. The quits rate was 2.3 percent. The number of quits edged up for total private and was unchanged for government. Quits increased in other services (+71,000). The number of quits increased in the Midwest region.
emphasis added
This series started in December 2000.
Note: The difference between JOLTS hires and separations is similar to the CES (payroll survey) net jobs headline numbers. This report is for March, the most recent employment report was for April.
 Click on graph for larger image.
Note that hires (dark blue) and total separations (red and light blue columns stacked) are pretty close each month. This is a measure of labor market turnover. When the blue line is above the two stacked columns, the economy is adding net jobs - when it is below the columns, the economy is losing jobs.
Jobs openings increased in March to 6.550 million from 6.078 in February.
The number of job openings (yellow) are up 16.8% year-over-year.
Quits are up 6.3% year-over-year. These are voluntary separations. (see light blue columns at bottom of graph for trend for "quits").
Job openings are at the highest level since this series started, and quits are increasing year-over-year. This was a strong report.
Small Business Optimism Index increased slightly in April, "Poor Sales" Near Record Low
by Calculated Risk on 5/08/2018 08:57:00 AM
From the National Federation of Independent Business (NFIB): April 2018 Report: Small Business Optimism Index
The Small Business Optimism Index sustained record-high levels increasing to 104.8 in April, driven by reports of improved profits, the highest in the NFIB Small Business Economic Trends Survey’s 45-year history. Additionally, the number of small businesses reporting poor sales fell to a near record low.
..
Reports of employment gains remain strong among small businesses ... Owners reported adding a net 0.28 workers per firm on average, the third highest reading since 2006 (down from 0.36 workers reported last month, the highest since 2006). ...
Fifty-seven percent reported hiring or trying to hire (up 4 points), but 50 percent (88 percent of those hiring or trying to hire) reported few or no qualified applicants for the positions they were trying to fill. Twenty-two percent of owners cited the difficulty of finding qualified workers as their Single Most Important Business Problem (up 1 point), exceeding the percentage citing taxes or regulations.
emphasis added
 Click on graph for larger image.
This graph shows the small business optimism index since 1986.
The index increased to 104.8 in April.
Note: Usually small business owners complain about taxes and regulations. However, during the recession, "poor sales" was the top problem.
Now the difficulty of finding qualified workers is the top problem.
Monday, May 07, 2018
Tuesday: Fed Chair Powell Panel Discussion, Job Openings, Small Business Confidence
by Calculated Risk on 5/07/2018 07:13:00 PM
From Matthew Graham at Mortgage News Daily: Mortgage Rates Still Waiting to Make a Move
Mortgage rates have been exceptionally sideways for nearly 2 weeks now--this after hitting the highest levels in more than 4 years on April 25th. [30YR FIXED - 4.625%-4.75%]Tuesday:
emphasis added
• At 3:15 AM ET, Panel Discussion, Fed Chair Jerome Powell, Watch Live Monetary Policy Influences on Global Financial Conditions and International Capital Flows, At the Swiss National Bank and International Monetary Fund High Level Conference on the International Monetary System, Zurich, Switzerland
• At 6:00 AM, NFIB Small Business Optimism Index for April.
• At 10:00 AM, Job Openings and Labor Turnover Survey for March from the BLS.
Leading Index for Commercial Real Estate Increases in April
by Calculated Risk on 5/07/2018 03:52:00 PM
Note: This index is possibly a leading indicator for new non-residential Commercial Real Estate (CRE) investment, except manufacturing.
From Dodge Data Analytics: Dodge Momentum Index Moves Higher in April
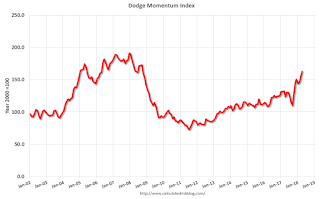
The Dodge Momentum Index jumped 6.1% in April to 163.0 (2000=100) from the revised March reading of 153.7. The Momentum Index is a monthly measure of the first (or initial) report for nonresidential building projects in planning, which have been shown to lead construction spending for nonresidential buildings by a full year. Both components of the Momentum Index moved higher in April, with the commercial component up 6.3% and the institutional component up 5.8%. Over the last two months the commercial portion of the Momentum Index has posted the most aggressive growth, fueled by continued low vacancy rates for commercial buildings as well as the potential benefits from the tax cuts passed in December. The gains for the institutional component, while healthy, have been more moderate reflecting the ebb and flow of public funding for larger education and public building projects.
emphasis added
 Click on graph for larger image.
This graph shows the Dodge Momentum Index since 2002. The index was at 163.0 in April, up from 143.7 in March.
According to Dodge, this index leads "construction spending for nonresidential buildings by a full year". This suggests further growth in 2018 and into 2019.
Update: Framing Lumber Prices Up Sharply Year-over-year, At Record Prices
by Calculated Risk on 5/07/2018 12:01:00 PM
Here is another monthly update on framing lumber prices. Early in 2013 lumber prices came close to the housing bubble highs - and now prices are well above the bubble highs.
This graph shows two measures of lumber prices: 1) Framing Lumber from Random Lengths through March 2018 (via NAHB), and 2) CME framing futures.

Right now Random Lengths prices are up 22% from a year ago, and CME futures are up about 51% year-over-year.
There is a seasonal pattern for lumber prices. Prices frequently peak around May, and bottom around October or November - although there is quite a bit of seasonal variability.
Rising costs - both material and labor - will be headwinds for the building industry this year.
Black Knight Mortgage Monitor for March
by Calculated Risk on 5/07/2018 09:06:00 AM
Black Knight released their Mortgage Monitor report for February today. According to Black Knight, 3.73% of mortgages were delinquent in March, up from 3.62% in March 2017. The increase was primarily due to the hurricanes. Black Knight also reported that 0.63% of mortgages were in the foreclosure process, down from 0.88% a year ago.
This gives a total of 4.36% delinquent or in foreclosure.
Press Release: Black Knight’s Mortgage Monitor: Home Prices See Strongest Start to Any Year Since 2005; San Jose’s 12-Month Growth Greater than Median Prices in Half of 100 Largest Markets
Today, the Data & Analytics division of Black Knight, Inc. released its latest Mortgage Monitor Report, based on data as of the end of March 2018. This month, leveraging data from the Black Knight Home Price Index, the company finds that 2018 home prices have seen the strongest gains to start any year since 2005. Home price growth has been widespread – 98 of the largest markets and 97 percent of 916 observed Core Based Statistical Areas (CBSAs) have all had annual increases, with the Western United States seeing some of the greatest gains. As Black Knight Data & Analytics Executive Vice President Ben Graboske explained, acceleration in the annual rate of home price appreciation at the national level continued through February, but that acceleration is not being seen in all markets.
“At the national level, home prices rose 1.24 percent since the start of 2018, with both January and February having their strongest respective single-month growth rates in 13 years,” said Graboske. “As of the end of February, home prices had risen 6.65 percent from a year ago, a metric that continues to increase. The rate of appreciation has accelerated by 42 basis points over the past six months and by 72 basis points over the past 12 months. This acceleration, combined with a nearly 40 basis point increase in the prevailing 30-year fixed interest rate during that same time frame, is creating a tighter affordability climate. We have now seen monthly increases in the national median home price for 27 of the past 28 months, and annual gains for 70 consecutive months.
“While almost all markets are seeing home prices rise, rates of appreciation vary across the country with the highest being seen in Western states. In fact, of the 11 markets with price gains of 10 percent or more, all 11 are in the Western United States. Across the country, we see an approximately 60-40 split in the number of markets experiencing home price appreciation vs. those with some degree of deceleration. By far, the heaviest areas of acceleration are San Jose and Las Vegas. The former has seen the rate of appreciation increase by 18 percent from just under six percent at the start of 2017 to a 24.1 percent annual rise in home prices as of February. The median home price in San Jose now stands at $1.17 million – the highest of any metro – an increase of $226,000 from just one year ago. To put that in perspective, more than half of the nation’s 100 largest markets have median home prices below this $226,000 annual growth in San Jose’s median home price. In Las Vegas, which has now surpassed Seattle as the second fastest-appreciating market nationwide, home prices are up nearly 15 percent from last year. Even so, Las Vegas home prices remain 22 percent below their pre-recession peak.”
The month’s data also showed the continued impact of rising mortgage interest rates on the population of borrowers who could both likely qualify for and gain a rate benefit from refinancing. There are now nearly 2 million fewer refinance candidates than there were entering 2018, a 46 percent decline. The total number of refinance candidates now stands at 2.3 million, the fewest since November 2008, when interest rates were above 6.0 percent. Additionally, the incentive for borrowers to refinance in order to lower their interest rates is all but non-existent among mortgages originated in the past five years. Of the nearly 28 million borrowers with 30-year mortgages originated in 2012 or later, fewer than 45,000 have 75 basis points of interest rate incentive to refinance while also meeting broad-based eligibility requirements.
emphasis added
 Click on graph for larger image.
This graph from Black Knight shows the 90 default activity in the hurricane impacted states.
From Black Knight:
• Prior to the 2017 hurricanes, Texas and Florida accounted for approximately 15% of all default activity for the last 5+ years
• The post-hurricane surge in defaults drove that share as high as 50% in November 2017; it has since subsided to roughly one in five defaults coming from the two states
• Default activity (which includes borrowers temporarily missing payments associated with forbearance plans) spiked from 51K in Q3 2017 to 184K in Q4
• Default activity remained elevated in January and February as well, with 65K defaults in Q1 2018 as a whole
• As of March, default volumes for Texas and Florida declined to 14,4K, only ~1K above the long-term (2000-2005) March average for the two states

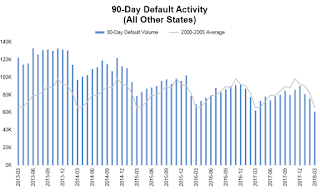
The second graph shows the national default activity excluding the hurricane impacted states.
• Nationally, Q1 2017 saw 282K defaults, just slightly below the 2000-2005 benchmark average (286K)There is much more in the mortgage monitor.
• In non-hurricane-affected areas, default volumes haven now fallen below these longterm benchmarks in each of the past 10 months
• This improvement is largely due to favorable macroeconomic trends, improved performance from seasoned mortgages and the overarching pristine quality of post-recession vintages
• Overall default activity for the 12 months ending March 2018 increased by 10% year-over year, driven by a 90% increase in default activity in Texas and Florida
• However, in non-hurricane affected states defaults were down by 5% year-over-year for the lowest 12-month total since 2004/2005
Sunday, May 06, 2018
Sunday Night Futures
by Calculated Risk on 5/06/2018 06:18:00 PM
Weekend:
• Schedule for Week of May 6, 2018
Monday:
• At 3:00 PM ET, Consumer Credit from the Federal Reserve. The consensus is for consumer credit to increase $16.0 billion in March.
From CNBC: Pre-Market Data and Bloomberg futures: S&P 500 are up 6, and DOW futures are up 66 (fair value).
Oil prices were up over the last week with WTI futures at $69.83 per barrel and Brent at $75.00 per barrel. A year ago, WTI was at $46, and Brent was at $47 - so oil prices are up about 50% year-over-year.
Here is a graph from Gasbuddy.com for nationwide gasoline prices. Nationally prices are at $2.80 per gallon. A year ago prices were at $2.34 per gallon - so gasoline prices are up 46 cents per gallon year-over-year.
Hotels: Occupancy Rate "dips" Year-over-Year, On Pace for Record Year
by Calculated Risk on 5/06/2018 08:09:00 AM
From HotelNewsNow.com: STR: US hotel results for week ending 28 April
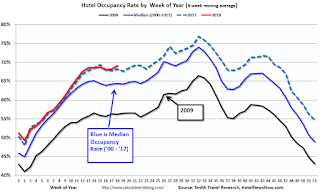
The U.S. hotel industry reported mixed year-over-year results in the three key performance metrics during the week of 22-28 April 2018, according to data from STR.The following graph shows the seasonal pattern for the hotel occupancy rate using the four week average.
In comparison with the week of 23-29 April 2017, the industry recorded the following:
• Occupancy: -0.6% to 69.8%
• Average daily rate (ADR): +2.3% to US$130.40
• Revenue per available room (RevPAR): +1.7% to US$91.05
emphasis added
 Click on graph for larger image.
The red line is for 2018, dash light blue is 2017 (record year due to hurricanes), blue is the median, and black is for 2009 (the worst year since the Great Depression for hotels).
The occupancy rate, to date, is slightly ahead of the record year in 2017 (2017 finished strong due to the impact of the hurricanes).
Data Source: STR, Courtesy of HotelNewsNow.com


