by Calculated Risk on 6/11/2018 02:53:00 PM
Monday, June 11, 2018
Update: Real Estate Agent Boom and Bust
Way back in 2005, I posted a graph of the Real Estate Agent Boom. Here is another update to the graph.
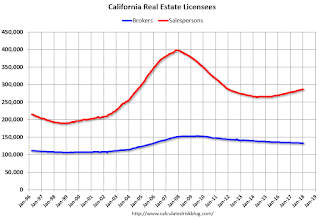
The graph shows the number of real estate licensees in California.
The number of agents peaked at the end of 2007 (housing activity peaked in 2005, and prices in 2006).
The number of salesperson's licenses is off 28% from the peak, and is increasing again (up 8.3% from low). The number of salesperson's licenses has increased to September 2004 levels.
Brokers' licenses are off 13.3% from the peak and have fallen to January 2006 levels, but are still slowly declining (down 1% year-over-year).

We are seeing a pickup in Real Estate licensees in California, although the number of Brokers is still declining.
Mortgage Equity Withdrawal slightly negative in Q1
by Calculated Risk on 6/11/2018 12:21:00 PM
Note: This is not Mortgage Equity Withdrawal (MEW) data from the Fed. The last MEW data from Fed economist Dr. Kennedy was for Q4 2008.
The following data is calculated from the Fed's Flow of Funds data (released yesterday) and the BEA supplement data on single family structure investment. This is an aggregate number, and is a combination of homeowners extracting equity - hence the name "MEW" - and normal principal payments and debt cancellation (modifications, short sales, and foreclosures).
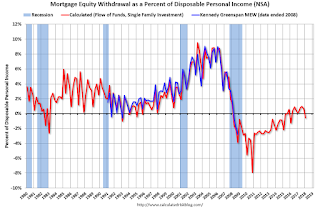
For Q1 2018, the Net Equity Extraction was a negative $22 billion, or a minus 0.6% of Disposable Personal Income (DPI) .

This graph shows the net equity extraction, or mortgage equity withdrawal (MEW), results, using the Flow of Funds (and BEA data) compared to the Kennedy-Greenspan method.
Note: This data is impacted by debt cancellation and foreclosures, but much less than a few years ago.
MEW has been positive for 9 of the last 11 quarters (seasonally Q1 is usually weak). With a slower rate of debt cancellation, MEW will likely be mostly positive going forward.
The Fed's Flow of Funds report showed that the amount of mortgage debt outstanding increased by $34 billion in Q1.
The Flow of Funds report also showed that Mortgage debt has declined by $0.6 trillion since the peak. This decline is mostly because of debt cancellation per foreclosures and short sales, and some from modifications. There has also been some reduction in mortgage debt as homeowners paid down their mortgages so they could refinance.
For reference:
Dr. James Kennedy also has a simple method for calculating equity extraction: "A Simple Method for Estimating Gross Equity Extracted from Housing Wealth". Here is a companion spread sheet (the above uses my simple method).
For those interested in the last Kennedy data included in the graph, the spreadsheet from the Fed is available here.
FOMC Preview
by Calculated Risk on 6/11/2018 09:22:00 AM
The consensus is that the Fed will increase the Fed Funds Rate 25bps at the meeting this week, and the tone will remain upbeat.
Assuming the expected happens, the focus will be on the wording of the statement, the projections, and Fed Chair Jerome Powell's press conference to try to determine how many rate hikes to expect in 2018 and in 2019.
Here are the March FOMC projections.
Current projections for Q2 GDP range from 3.1% to 4.5%. GDP increased at a 2.2% real annual rate in Q1. This puts first half GDP close to the top of the expected range, and GDP projections might be revised up.
| GDP projections of Federal Reserve Governors and Reserve Bank presidents | |||
|---|---|---|---|
| Change in Real GDP1 | 2018 | 2019 | 2020 |
| Mar 2018 | 2.6 to 3.0 | 2.2 to 2.6 | 1.8 to 2.1 |
| Dec 2017 | 2.2 to 2.6 | 1.9 to 2.3 | 1.7 to 2.0 |
The unemployment rate was at 3.8% in May. So the unemployment rate projection for 2018 will probably be lowered.
| Unemployment projections of Federal Reserve Governors and Reserve Bank presidents | |||
|---|---|---|---|
| Unemployment Rate2 | 2018 | 2019 | 2020 |
| Mar 2018 | 3.6 to 3.8 | 3.4 to 3.7 | 3.5 to 3.8 |
| Dec 2017 | 3.7 to 4.0 | 3.6 to 4.0 | 3.6 to 4.2 |
As of April, PCE inflation was up 2.0% from April 2017. Based on recent PCE readings, PCE inflation will likely be revised up for 2018.
| Inflation projections of Federal Reserve Governors and Reserve Bank presidents | |||
|---|---|---|---|
| PCE Inflation1 | 2018 | 2019 | 2020 |
| Mar 2018 | 1.8 to 2.0 | 2.0 to 2.2 | 2.1 to 2.2 |
| Dec 2017 | 1.7 to 1.9 | 2.0 | 2.0 to 2.1 |
PCE core inflation was up 1.8% in April year-over-year. Core PCE inflation might also be revised up for 2018.
| Core Inflation projections of Federal Reserve Governors and Reserve Bank presidents | |||
|---|---|---|---|
| Core Inflation1 | 2018 | 2019 | 2020 |
| Mar 2018 | 1.8 to 2.0 | 2.0 to 2.2 | 2.1 to 2.2 |
| Dec 2017 | 1.7 to 1.9 | 2.0 | 2.0 to 2.1 |
In general the data has been somewhat firmer than the FOMC's March projections, so it seems likely the FOMC will be on track for four rate hikes in 2018.
Sunday, June 10, 2018
Sunday Night Futures
by Calculated Risk on 6/10/2018 08:11:00 PM
Weekend:
• Schedule for Week of June 10, 2018
Monday:
• No major economic releases scheduled.
From CNBC: Pre-Market Data and Bloomberg futures: S&P 500 are down 5, and DOW futures are down 30 (fair value).
Oil prices were down slightly over the last week with WTI futures at $65.55 per barrel and Brent at $76.32 per barrel. A year ago, WTI was at $46, and Brent was at $47 - so oil prices are up about 50% year-over-year.
Here is a graph from Gasbuddy.com for nationwide gasoline prices. Nationally prices are at $2.92 per gallon. A year ago prices were at $2.33 per gallon - so gasoline prices are up 59 cents per gallon year-over-year.
Oil Rigs: "Now, back to the Permian Show"
by Calculated Risk on 6/10/2018 10:30:00 AM
A few comments from Steven Kopits of Princeton Energy Advisors LLC on June 8, 2018:
• Total US oil rigs were up 1 to 862
• Horizontal oil rigs added 5 to 763
...
• The Permian gained 7; the Cana Woodford gave back 3
• Since last July’s peak, 90 of the 105 horizontal oil rigs additions have been in the Permian; 12 in the Cana Woodford—and even the Cana Woodford is no higher than in November. All other plays have added a mere three rigs since last July
 Click on graph for larger image.
CR note: This graph shows the US horizontal rig count by basin.
Graph and comments Courtesy of Steven Kopits of Princeton Energy Advisors LLC.
Saturday, June 09, 2018
Schedule for Week of June 10, 2018
by Calculated Risk on 6/09/2018 08:11:00 AM
The key economic reports this week are the May Consumer Price Index (CPI) and Retail Sales.
For manufacturing, May industrial production, and the June New York survey, will be released this week.
The FOMC meets this week and is expected to raise the Fed Funds rate 25bps.
No major economic releases scheduled.
6:00 AM: NFIB Small Business Optimism Index for May.
8:30 AM: The Consumer Price Index for May from the BLS. The consensus is for a 0.2% increase in CPI, and a 0.2% increase in core CPI.
7:00 AM ET: The Mortgage Bankers Association (MBA) will release the results for the mortgage purchase applications index.
8:30 AM: The Producer Price Index for May from the BLS. The consensus is a 0.3% increase in PPI, and a 0.2% increase in core PPI.
2:00 PM: FOMC Meeting Announcement. The FOMC is expected to increase the Fed Funds rate 25 bps at this meeting.
2:00 PM: FOMC Forecasts This will include the Federal Open Market Committee (FOMC) participants' projections of the appropriate target federal funds rate along with the quarterly economic projections.
2:30 PM: Fed Chair Jerome Powell holds a press briefing following the FOMC announcement.
 8:30 AM ET: Retail sales for May will be released. The consensus is for a 0.4% increase in retail sales.
This graph shows the year-over-year change in retail sales and food service (ex-gasoline) since 1993. Retail and Food service sales, ex-gasoline, increased by 4.0% on a YoY basis.
8:30 AM ET: The initial weekly unemployment claims report will be released. The consensus is for 224 thousand initial claims, up from 222 thousand the previous week.
8:30 AM ET: The New York Fed Empire State manufacturing survey for June. The consensus is for a reading of 19.6, down from 20.1.
 9:15 AM: The Fed will release Industrial Production and Capacity Utilization for May.
This graph shows industrial production since 1967.
The consensus is for a 0.1% increase in Industrial Production, and for Capacity Utilization to be unchanged at 78.0%.
10:00 AM: State Employment and Unemployment (Monthly) for May 2018
10:00 AM: University of Michigan's Consumer sentiment index (Preliminary for June).
Friday, June 08, 2018
Bernanke Video: "What you are getting is a stimulus at the very wrong moment"
by Calculated Risk on 6/08/2018 04:42:00 PM
This discussion with Ben Bernanke is worth watching. He discusses monetary policy, QE, and the poor timing of the recent fiscal stimulus (something I've mentioned several times).
The Bernanke portion of the video ends around the 35 minute mark.
Q2 GDP Forecasts
by Calculated Risk on 6/08/2018 01:19:00 PM
From Merrill Lynch:
Better than expected trade data nudged up 2Q GDP tracking to 3.8% qoq saar [June 8 estimate].And from the Altanta Fed: GDPNow
emphasis added
The GDPNow model estimate for real GDP growth (seasonally adjusted annual rate) in the second quarter of 2018 is 4.5 percent on June 6, down from 4.8 percent on June 1. [June 8 estimate]From the NY Fed Nowcasting Report
The New York Fed Staff Nowcast stands at 3.1% for 2018:Q2 and 2.9% for 2018:Q3. [June 8 estimate]CR Note: These estimates suggest real annualized GDP in the 3% to 4.5% range in Q2.
AAR: Rail Carloads Up 3.2% YoY, Intermodal Up 6.6% YoY
by Calculated Risk on 6/08/2018 11:19:00 AM
From the Association of American Railroads (AAR) Rail Time Indicators. Graphs and excerpts reprinted with permission.
The U.S. economy is clicking right now, and freight railroads are both beneficiaries and enablers of that. In May 2018, originated carloads on U.S. railroads were up 3.2% over May 2017, the third straight month with year-over-year growth greater than 3%. In May 2018, 15 of the 20 commodity categories the AAR tracks saw higher carloads, including nearly all the major categories. Total carloads averaged 263,884 in May 2018, the most for May since 2015. … May was a good month for intermodal too: U.S. intermodal originations in May 2018 were up 6.6% over last year.
 Click on graph for larger image.
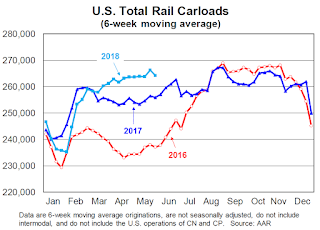
This graph from the Rail Time Indicators report shows U.S. average weekly rail carloads (NSA). Light blue is 2018.
Rail carloads have been weak over the last decade due to the decline in coal shipments.
U.S. railroads originated 1,319,420 carloads in May 2018, up 3.2% (41,078 carloads) over May 2017. Year-over-year carloads have risen by more than 3% for three straight months. Carloads averaged 263,884 in May 2018, the most for May since 2015. Year-to-date carloads through May (5.67 million) were up 1.2%, or 66,071 carloads, over the first five months of last year and were up 8.1% (422,829 carloads) over the first five months of 2016.
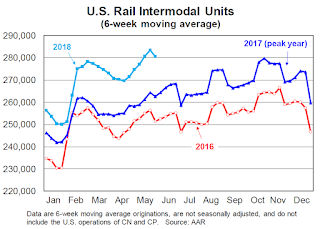
 The second graph is for intermodal traffic (using intermodal or shipping containers):
U.S. railroads originated 1,398,203 intermodal containers and trailers in May 2018, up 6.6%, or 86,010 units, over May 2017. Average weekly intermodal volume in May 2018 was 279,641 units — that’s the second most in history. (Only February 2018, at 279,853, had more.)
Year-to-date intermodal volume through May was a record 5,993,584, up 6.0%, or 336,944 units, over the same period in 2017. Barring a catastrophe, this year will be another record year for U.S. intermodal.
Hotels: Occupancy Rate increased Year-over-Year, On Record Annual Pace
by Calculated Risk on 6/08/2018 08:58:00 AM
From HotelNewsNow.com: STR: US hotel results for week ending 2 June
The U.S. hotel industry reported positive year-over-year results in the three key performance metrics during the week of 27 May through 2 June 2018, according to data from STR.The following graph shows the seasonal pattern for the hotel occupancy rate using the four week average.
In comparison with the week of 28 May through 3 June 2017, the industry recorded the following:
• Occupancy: +0.1% to 64.1%
• Average daily rate (ADR): +2.1% to US$122.58
• Revenue per available room (RevPAR): +2.3% to US$78.61
emphasis added
 Click on graph for larger image.
The red line is for 2018, dash light blue is 2017 (record year due to hurricanes), blue is the median, and black is for 2009 (the worst year probably since the Great Depression for hotels).
The occupancy rate, to date, is slightly ahead of the record year in 2017 (2017 finished strong due to the impact of the hurricanes).
On a seasonal basis, the occupancy rate will now increase as the summer travel season starts.
Data Source: STR, Courtesy of HotelNewsNow.com


