by Calculated Risk on 6/21/2018 08:33:00 AM
Thursday, June 21, 2018
Weekly Initial Unemployment Claims at 218,000
The DOL reported:
In the week ending June 16, the advance figure for seasonally adjusted initial claims was 218,000, a decrease of 3,000 from the previous week's revised level. The previous week's level was revised up by 3,000 from 218,000 to 221,000. The 4-week moving average was 221,000, a decrease of 4,000 from the previous week's revised average. The previous week's average was revised up by 750 from 224,250 to 225,000.The previous week was revised up.
emphasis added
The following graph shows the 4-week moving average of weekly claims since 1971.
 Click on graph for larger image.
The dashed line on the graph is the current 4-week average. The four-week average of weekly unemployment claims decreased to 221,000.
This was lower than the consensus forecast. The low level of claims suggest few layoffs.
Black Knight: National Mortgage Delinquency Rate Decreased in May, Foreclosure Inventory Close to Pre-Recession Average
by Calculated Risk on 6/21/2018 07:00:00 AM
From Black Knight: Black Knight’s First Look: May 2018 Sees Second Fewest Foreclosure Starts in 17 Years; Active Foreclosure Inventory on Pace to Hit Pre-Recession Average in Early Q3 2018
• At 44,900, May 2018 saw the second lowest monthly foreclosure starts in more than 17 yearsAccording to Black Knight's First Look report for May, the percent of loans delinquent decreased 0.8% in May compared to April, and decreased 4.1% year-over-year.
• Just 303,000 mortgages remain in active foreclosure; at 0.59 percent, the national foreclosure rate is now at its lowest point in 15 years
• At the current rate of decline, national foreclosure inventories are on pace to hit the pre-recession average (2000-2005) in early Q3 2018
• May marked five consecutive months of declining delinquencies, as post-hurricane improvement continues
• Delinquency improvements in hurricane-affected areas more than offset slight increases in non-impacted markets in May, dropping the national delinquency rate to its lowest level in 15 months
The percent of loans in the foreclosure process decreased 3.3% in May and were down 28.7% over the last year.
Black Knight reported the U.S. mortgage delinquency rate (loans 30 or more days past due, but not in foreclosure) was 3.64% in May, down from 3.67% in April.
The percent of loans in the foreclosure process decreased in May to 0.59%.
The number of delinquent properties, but not in foreclosure, is down 60,000 properties year-over-year, and the number of properties in the foreclosure process is down 118,000 properties year-over-year.
| Black Knight: Percent Loans Delinquent and in Foreclosure Process | ||||
|---|---|---|---|---|
| May 2018 | Apr 2018 | May 2017 | May 2016 | |
| Delinquent | 3.64% | 3.67% | 3.79% | 4.25% |
| In Foreclosure | 0.59% | 0.61% | 0.83% | 1.13% |
| Number of properties: | ||||
| Number of properties that are delinquent, but not in foreclosure: | 1,867,000 | 1,885,000 | 1,927,000 | 2,153,000 |
| Number of properties in foreclosure pre-sale inventory: | 303,000 | 314,000 | 421,000 | 574,000 |
| Total Properties | 2,171,000 | 2,199,000 | 2,348,000 | 2,727,000 |
Wednesday, June 20, 2018
Thursday: Unemployment Claims, Philly Fed Mfg
by Calculated Risk on 6/20/2018 07:05:00 PM
Thursday:
• At 8:30 AM ET, The initial weekly unemployment claims report will be released. The consensus is for 220 thousand initial claims, up from 218 thousand the previous week.
• At 8:30 AM, the Philly Fed manufacturing survey for June. The consensus is for a reading of 26.0, down from 34.4.
• At 9:00 AM, FHFA House Price Index for April 2018. This was originally a GSE only repeat sales, however there is also an expanded index.
AIA: "Architecture firm billings strengthen in May"
by Calculated Risk on 6/20/2018 02:31:00 PM
Note: This index is a leading indicator primarily for new Commercial Real Estate (CRE) investment.
From the AIA: Architecture firm billings strengthen in May
Architecture firm billings grew in May, marking the eighth consecutive month of solid growth, according to a new report today from The American Institute of Architects (AIA).
Overall, the AIA’s Architecture Billings Index (ABI) score for May was 52.8 (any score over 50 is billings growth), which shows that demand for services from architecture firms continues to be healthy. The ABI also indicated that business conditions remain strong at firms located in the South and West, while growth in billings was modest at firms in the Northeast and Midwest.
“Architecture firms continue to have plenty of work as they enter the busiest part of the design and construction season,” said AIA Chief Economist Kermit Baker, Hon. AIA, PhD. “This is especially true for firms serving the institutional building sector, which reported their strongest growth in billings in several years.”
...
• Regional averages: West (51.9), Midwest (50.2), South (55.0), Northeast (50.6)
• Sector index breakdown: multi-family residential (52.1), institutional (54.3), commercial/industrial (53.6), mixed practice (47.9)
emphasis added
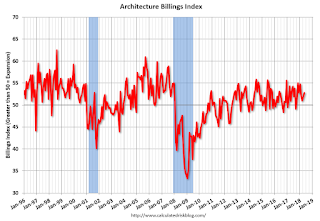 Click on graph for larger image.
This graph shows the Architecture Billings Index since 1996. The index was at 52.8 in May, up from 52.0 in April. Anything above 50 indicates expansion in demand for architects' services.
Note: This includes commercial and industrial facilities like hotels and office buildings, multi-family residential, as well as schools, hospitals and other institutions.
According to the AIA, there is an "approximate nine to twelve month lag time between architecture billings and construction spending" on non-residential construction. This index was positive in 11 of the last 12 months, suggesting a further increase in CRE investment in 2018.
A Few Comments on May Existing Home Sales
by Calculated Risk on 6/20/2018 11:59:00 AM
Earlier: NAR: "Existing-Home Sales Backpedal, Decrease 0.4 Percent in May"
A few key points:
1) As usual, housing economist Tom Lawler's forecast was closer to the NAR report than the consensus. See: Lawler: Early Read on Existing Home Sales in April. The consensus was for sales of 5.56 million SAAR, Lawler estimated the NAR would report 5.47 million SAAR in May, and the NAR actually reported 5.43 million.
2) Inventory is still very low and falling year-over-year (YoY) with inventory down 6.1% year-over-year in May. This was the 36th consecutive month with a year-over-year decline in inventory, however the YoY declines have been getting smaller.
And some areas of the country are now reporting YoY increases in inventory. As an example, the CAR reported yesterday that inventory in California was up 8.3% YoY in May. More inventory would probably mean smaller price increases.
The following graph shows existing home sales Not Seasonally Adjusted (NSA).
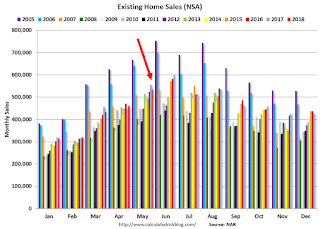
Sales NSA in May (536,000, red column) were below sales in May 2017 (555,000, NSA).
Sales NSA through May(first five months) are down about 1.4% from the same period in 2017.
This is a small decline - and it is too early to tell if there is an impact from higher interest rates and / or the changes to the tax law on home sales.
NAR: "Existing-Home Sales Backpedal, Decrease 0.4 Percent in May"
by Calculated Risk on 6/20/2018 10:10:00 AM
From the NAR: Existing-Home Sales Backpedal, Decrease 0.4 Percent in May
Existing-home sales fell back for the second straight month in May, as only the Northeast region saw an uptick in activity, according to the National Association of Realtors®.
Total existing-home sales, which are completed transactions that include single-family homes, townhomes, condominiums and co-ops, decreased 0.4 percent to a seasonally adjusted annual rate of 5.43 million in May from downwardly revised 5.45 million in April. With last month’s decline, sales are now 3.0 percent below a year ago and have fallen year-over-year for three straight months.
...
Total housing inventory at the end of May climbed 2.8 percent to 1.85 million existing homes available for sale, but is still 6.1 percent lower than a year ago (1.97 million) and has fallen year-over-year for 36 consecutive months. Unsold inventory is at a 4.1-month supply at the current sales pace (4.2 months a year ago).
emphasis added
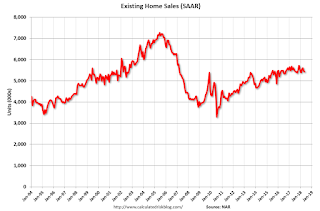 Click on graph for larger image.
This graph shows existing home sales, on a Seasonally Adjusted Annual Rate (SAAR) basis since 1993.
Sales in May (5.43 million SAAR) were 0.4% lower than last month, and were 3.0% below the May 2017 rate.
The second graph shows nationwide inventory for existing homes.
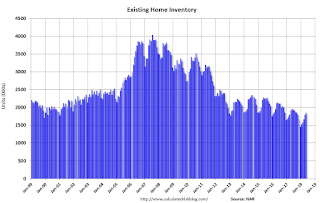 According to the NAR, inventory increased to 1.85 million in May from 1.80 million in April. Headline inventory is not seasonally adjusted, and inventory usually decreases to the seasonal lows in December and January, and peaks in mid-to-late summer.
The last graph shows the year-over-year (YoY) change in reported existing home inventory and months-of-supply. Since inventory is not seasonally adjusted, it really helps to look at the YoY change. Note: Months-of-supply is based on the seasonally adjusted sales and not seasonally adjusted inventory.
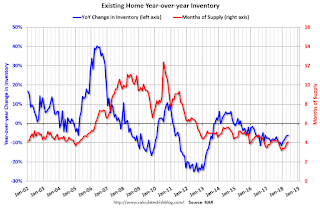 Inventory decreased 6.1% year-over-year in May compared to May 2017.
 Months of supply was at 4.1 months in May.
Sales were below the consensus view. For existing home sales, a key number is inventory - and inventory is still low, but appears to be bottoming in some areas. I'll have more later ...
MBA: Mortgage Applications Increase in Latest Weekly Survey
by Calculated Risk on 6/20/2018 07:00:00 AM
From the MBA: Mortgage Applications Increase in Latest MBA Weekly Survey
Mortgage applications increased 5.1 percent from one week earlier, according to data from the Mortgage Bankers Association’s (MBA) Weekly Mortgage Applications Survey for the week ending June 15, 2018.
... The Refinance Index increased 6 percent from the previous week. The seasonally adjusted Purchase Index increased 4 percent from one week earlier. The unadjusted Purchase Index increased 1 percent compared with the previous week and was 3 percent higher than the same week one year ago. ...
The average contract interest rate for 30-year fixed-rate mortgages with conforming loan balances ($453,100 or less) remained unchanged at 4.83 percent, with points decreasing to 0.48 from 0.53 (including the origination fee) for 80 percent loan-to-value ratio (LTV) loans.
emphasis added
 Click on graph for larger image.
The first graph shows the refinance index since 1990.
Refinance activity will not pick up significantly unless mortgage rates fall 50 bps or more from the recent level.
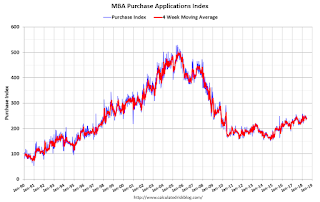 The second graph shows the MBA mortgage purchase index
 According to the MBA, purchase activity is up 3% year-over-year.
Tuesday, June 19, 2018
Wednesday: Existing Home Sales
by Calculated Risk on 6/19/2018 07:54:00 PM
Wednesday:
• At 7:00 AM ET: The Mortgage Bankers Association (MBA) will release the results for the mortgage purchase applications index.
• At 9:30 AM: Panel Discussion, Fed Chair Jerome Powell, Monetary Policy at a Time of Uncertainty and Tight Labor Markets, At the ECB Forum on Central Banking, Linhó Sintra, Portugal
• At 10:00 AM: Existing Home Sales for May from the National Association of Realtors (NAR). The consensus is for 5.56 million SAAR, up from 5.46 million in April. Housing economist Tom Lawler estimates the NAR will reports sales of 5.47 million SAAR for May and that inventory will be down 5.1% year-over-year.
• At During the day: The AIA's Architecture Billings Index for May (a leading indicator for commercial real estate).
Existing Home Inventory: Up 8.3% Year-over-year in California
by Calculated Risk on 6/19/2018 04:37:00 PM
It appears inventory has bottomed in some areas. The CAR reported today: California median home price sets new record as home sales dial back, C.A.R. reports
The number of statewide active listings improved for the second consecutive month, increasing 8.3 percent from the previous year.Here is some data from the NAR and CAR (ht Tom Lawler)
…
“As we predicted last month, California’s statewide median home price broke the previous pre-recession peak set in May 2007 and hit another high as tight supply conditions continued to pour fuel on the price appreciation fire,” said C.A.R. Senior Vice President and Chief Economist Leslie Appleton-Young. “With inventory starting to show signs of improvement, however, home price appreciation could decelerate in the second half of the year, especially since further rate increases are expected to hamper homebuyers’ affordability and limit how much they are willing to pay for their new home.”
emphasis added
| YOY % Change, Existing SF Homes for Sale | ||
|---|---|---|
| NAR (National) | CAR (California) | |
| Sep-17 | -8.4% | -11.2% |
| Oct-17 | -10.4% | -11.5% |
| Nov-17 | -9.7% | -11.5% |
| Dec-17 | -11.5% | -12.0% |
| Jan-18 | -9.5% | -6.6% |
| Feb-18 | -8.6% | -1.3% |
| Mar-18 | -7.2% | -1.0% |
| Apr-18 | -6.3% | 1.9% |
| May-18 | --- | 8.3% |
Existing Home Sales: Take the Under for May
by Calculated Risk on 6/19/2018 02:08:00 PM
Housing economist Tom Lawler has been sending me his predictions of what the NAR will report for 8+ years. The table below shows the consensus for each month, Lawler's predictions, and the NAR's initially reported level of sales.
Lawler hasn't always been closer than the consensus, but usually when there has been a fairly large spread between Lawler's estimate and the "consensus", Lawler has been closer.
As an example, last month, for April 2018, the consensus was for sales of 5.60 million on a seasonally adjusted annual rate (SAAR) basis. Lawler estimated 5.48 million, and the NAR reported 5.46 million (the consensus missed by 140 thousand compared to 20 thousand for Lawler).
NOTE: There have been times when Lawler "missed", but then he pointed out an apparent error in the NAR data - and the subsequent revision corrected that error. As an example, see: The “Curious Case” of Existing Home Sales in the South in April
For May 2018, the consensus is that the NAR will report sales of 5.56 million SAAR. However, housing economist Tom Lawler estimates the NAR will report sales of 5.47 million.
Lawler's estimate is a little below the consensus, so I'd take the under for May. Note: The NAR is scheduled to report May Existing Home Sales tomorrow Wednesday, June 20th at 10:00 AM ET.
Over the last eight years, the consensus average miss was 147 thousand, and Lawler's average miss was 69 thousand.
| Existing Home Sales, Forecasts and NAR Report millions, seasonally adjusted annual rate basis (SAAR) | |||
|---|---|---|---|
| Month | Consensus | Lawler | NAR reported1 |
| May-10 | 6.20 | 5.83 | 5.66 |
| Jun-10 | 5.30 | 5.30 | 5.37 |
| Jul-10 | 4.66 | 3.95 | 3.83 |
| Aug-10 | 4.10 | 4.10 | 4.13 |
| Sep-10 | 4.30 | 4.50 | 4.53 |
| Oct-10 | 4.50 | 4.46 | 4.43 |
| Nov-10 | 4.85 | 4.61 | 4.68 |
| Dec-10 | 4.90 | 5.13 | 5.28 |
| Jan-11 | 5.20 | 5.17 | 5.36 |
| Feb-11 | 5.15 | 5.00 | 4.88 |
| Mar-11 | 5.00 | 5.08 | 5.10 |
| Apr-11 | 5.20 | 5.15 | 5.05 |
| May-11 | 4.75 | 4.80 | 4.81 |
| Jun-11 | 4.90 | 4.71 | 4.77 |
| Jul-11 | 4.92 | 4.69 | 4.67 |
| Aug-11 | 4.75 | 4.92 | 5.03 |
| Sep-11 | 4.93 | 4.83 | 4.91 |
| Oct-11 | 4.80 | 4.86 | 4.97 |
| Nov-11 | 5.08 | 4.40 | 4.42 |
| Dec-11 | 4.60 | 4.64 | 4.61 |
| Jan-12 | 4.69 | 4.66 | 4.57 |
| Feb-12 | 4.61 | 4.63 | 4.59 |
| Mar-12 | 4.62 | 4.59 | 4.48 |
| Apr-12 | 4.66 | 4.53 | 4.62 |
| May-12 | 4.57 | 4.66 | 4.55 |
| Jun-12 | 4.65 | 4.56 | 4.37 |
| Jul-12 | 4.50 | 4.47 | 4.47 |
| Aug-12 | 4.55 | 4.87 | 4.82 |
| Sep-12 | 4.75 | 4.70 | 4.75 |
| Oct-12 | 4.74 | 4.84 | 4.79 |
| Nov-12 | 4.90 | 5.10 | 5.04 |
| Dec-12 | 5.10 | 4.97 | 4.94 |
| Jan-13 | 4.90 | 4.94 | 4.92 |
| Feb-13 | 5.01 | 4.87 | 4.98 |
| Mar-13 | 5.03 | 4.89 | 4.92 |
| Apr-13 | 4.92 | 5.03 | 4.97 |
| May-13 | 5.00 | 5.20 | 5.18 |
| Jun-13 | 5.27 | 4.99 | 5.08 |
| Jul-13 | 5.13 | 5.33 | 5.39 |
| Aug-13 | 5.25 | 5.35 | 5.48 |
| Sep-13 | 5.30 | 5.26 | 5.29 |
| Oct-13 | 5.13 | 5.08 | 5.12 |
| Nov-13 | 5.02 | 4.98 | 4.90 |
| Dec-13 | 4.90 | 4.96 | 4.87 |
| Jan-14 | 4.70 | 4.67 | 4.62 |
| Feb-14 | 4.64 | 4.60 | 4.60 |
| Mar-14 | 4.56 | 4.64 | 4.59 |
| Apr-14 | 4.67 | 4.70 | 4.65 |
| May-14 | 4.75 | 4.81 | 4.89 |
| Jun-14 | 4.99 | 4.96 | 5.04 |
| Jul-14 | 5.00 | 5.09 | 5.15 |
| Aug-14 | 5.18 | 5.12 | 5.05 |
| Sep-14 | 5.09 | 5.14 | 5.17 |
| Oct-14 | 5.15 | 5.28 | 5.26 |
| Nov-14 | 5.20 | 4.90 | 4.93 |
| Dec-14 | 5.05 | 5.15 | 5.04 |
| Jan-15 | 5.00 | 4.90 | 4.82 |
| Feb-15 | 4.94 | 4.87 | 4.88 |
| Mar-15 | 5.04 | 5.18 | 5.19 |
| Apr-15 | 5.22 | 5.20 | 5.04 |
| May-15 | 5.25 | 5.29 | 5.35 |
| Jun-15 | 5.40 | 5.45 | 5.49 |
| Jul-15 | 5.41 | 5.64 | 5.59 |
| Aug-15 | 5.50 | 5.54 | 5.31 |
| Sep-15 | 5.35 | 5.56 | 5.55 |
| Oct-15 | 5.41 | 5.33 | 5.36 |
| Nov-15 | 5.32 | 4.97 | 4.76 |
| Dec-15 | 5.19 | 5.36 | 5.46 |
| Jan-16 | 5.32 | 5.36 | 5.47 |
| Feb-16 | 5.30 | 5.20 | 5.08 |
| Mar-16 | 5.27 | 5.27 | 5.33 |
| Apr-16 | 5.40 | 5.44 | 5.45 |
| May-16 | 5.64 | 5.55 | 5.53 |
| Jun-16 | 5.48 | 5.62 | 5.57 |
| Jul-16 | 5.52 | 5.41 | 5.39 |
| Aug-16 | 5.44 | 5.49 | 5.33 |
| Sep-16 | 5.35 | 5.55 | 5.47 |
| Oct-16 | 5.44 | 5.47 | 5.60 |
| Nov-16 | 5.54 | 5.60 | 5.61 |
| Dec-16 | 5.54 | 5.55 | 5.49 |
| Jan-17 | 5.55 | 5.60 | 5.69 |
| Feb-17 | 5.55 | 5.41 | 5.48 |
| Mar-17 | 5.61 | 5.74 | 5.71 |
| Apr-17 | 5.67 | 5.56 | 5.57 |
| May-17 | 5.55 | 5.65 | 5.62 |
| Jun-17 | 5.58 | 5.59 | 5.52 |
| Jul-17 | 5.57 | 5.38 | 5.44 |
| Aug-17 | 5.48 | 5.39 | 5.35 |
| Sep-17 | 5.30 | 5.38 | 5.39 |
| Oct-17 | 5.30 | 5.60 | 5.48 |
| Nov-17 | 5.52 | 5.77 | 5.81 |
| Dec-17 | 5.75 | 5.66 | 5.57 |
| Jan-18 | 5.65 | 5.48 | 5.38 |
| Feb-18 | 5.42 | 5.44 | 5.54 |
| Mar-18 | 5.28 | 5.51 | 5.60 |
| Apr-18 | 5.60 | 5.48 | 5.46 |
| May-18 | 5.56 | 5.47 | --- |
| 1NAR initially reported before revisions. | |||


