by Calculated Risk on 7/01/2018 09:17:00 PM
Sunday, July 01, 2018
Monday: ISM Manufacturing, Construction Spending
Weekend:
• Schedule for Week of July 1, 2018
Monday:
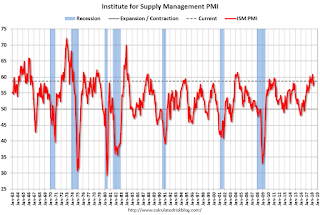
• At 10:00 AM ET, ISM Manufacturing Index for June. The consensus is for the ISM to be at 58.3, down from 58.7 in May. The PMI was at 58.7% in May, the employment index was at 56.3%, and the new orders index was at 63.7%.
• Also at 10:00 AM, Construction Spending for May. The consensus is for a 0.6% increase in construction spending.
From CNBC: Pre-Market Data and Bloomberg futures: S&P 500 are up 4, and DOW futures are up 55 (fair value).
Oil prices were up over the last week with WTI futures at $73.40 per barrel and Brent at $78.39 per barrel. A year ago, WTI was at $46, and Brent was at $47 - so oil prices are up more than 50% year-over-year.
Here is a graph from Gasbuddy.com for nationwide gasoline prices. Nationally prices are at $2.85 per gallon. A year ago prices were at $2.22 per gallon - so gasoline prices are up 63 cents per gallon year-over-year.
June 2018: Unofficial Problem Bank list unchanged at 92 Institutions, Q2 2018 Transition Matrix
by Calculated Risk on 7/01/2018 01:05:00 PM
Note: Surferdude808 compiles an unofficial list of Problem Banks compiled only from public sources.
Here is the unofficial problem bank list for June 2018.
Here are the monthly changes and a few comments from surferdude808:
Update on the Unofficial Problem Bank List for June 2018. During the month, the list count was unchanged on a net basis after one removal and one addition. However, assets increased by a substantial $42.0 billion during the month to $60.0 billion. A year ago, the list held 137 institutions with assets of $35.2 billion.
This month, the action against Legacy State Bank, Loganville, GA ($92 million) was terminated.
The large jump in assets this month results from the addition of Deutsche Bank Trust Company Americas, New York, NY ($42.1 billion) to the list. In our last post on the list at the end of May, we noted the large increase in assets on the FDIC’s Official Problem Bank List they disclosed on May25th. At that time we suspected the large increase resulted from the FDIC adding a domestically charted bank with foreign ownership. A few days after our post, several major media outlets confirmed our suspicions. Interestingly, however, is that the Federal Reserve issued the enforcement action to Deutsche Bank Trust Company Americas back in May 2017. It makes us wonder why the bank did not make it onto FDIC’s official list until March 2018.
With it being the end of the second quarter, we bring an updated transition matrix to detail how banks are moving off the Unofficial Problem Bank List. Since the Unofficial Problem Bank List was first published on August 7, 2009 with 389 institutions, a total of 1,731 institutions have appeared on a weekly or monthly list at some point. Only 5.3 percent of the banks that have appeared on a list remain today. In all, there have been 1,639 institutions that have transitioned through the list. Departure methods include 960 action terminations, 406 failures, 256 mergers, and 17 voluntary liquidations. Of the 389 institutions on the first published list, only 9 or 2.3 percent still remain in a designated troubled status more than eight years later. The 406 failures represent 23.5 percent of the 1,731 institutions that have made an appearance on the list. This failure rate is well above the 10-12 percent rate frequently cited in media reports on the failure rate of banks on the FDIC's official list.
| Unofficial Problem Bank List | |||
|---|---|---|---|
| Change Summary | |||
| Number of Institutions | Assets ($Thousands) | ||
| Start (8/7/2009) | 389 | 276,313,429 | |
| Subtractions | |||
| Action Terminated | 178 | (65,500,762) | |
| Unassisted Merger | 40 | (9,818,439) | |
| Voluntary Liquidation | 4 | (10,584,114) | |
| Failures | 158 | (186,397,337) | |
| Asset Change | (449,522) | ||
| Still on List at 6/30/2018 | 9 | 3,563,255 | |
| Additions after 8/7/2009 | 83 | 56,456,770 | |
| End (6/30/2018) | 92 | 60,020,025 | |
| Intraperiod Removals1 | |||
| Action Terminated | 782 | 320,707,101 | |
| Unassisted Merger | 216 | 82,115,858 | |
| Voluntary Liquidation | 13 | 2,515,855 | |
| Failures | 248 | 125,152,210 | |
| Total | 1,259 | 530,491,024 | |
| 1Institution not on 8/7/2009 or 6/30/2018 list but appeared on a weekly list. | |||
Saturday, June 30, 2018
Schedule for Week of July 1, 2018
by Calculated Risk on 6/30/2018 08:11:00 AM
The key report this week is the June employment report on Friday.
Other key indicators include the June ISM manufacturing and non-manufacturing indexes, June auto sales, and the May trade deficit.
 10:00 AM: ISM Manufacturing Index for June. The consensus is for the ISM to be at 58.3, down from 58.7 in May.
Here is a long term graph of the ISM manufacturing index.
The PMI was at 58.7% in May, the employment index was at 56.3%, and the new orders index was at 63.7%.
10:00 AM: Construction Spending for May. The consensus is for a 0.6% increase in construction spending.
Early: Reis Q2 2018 Mall Survey of rents and vacancy rates.
 All day: Light vehicle sales for June. The consensus is for light vehicle sales to be 17.0 million SAAR in June, up from 16.8 million in May (Seasonally Adjusted Annual Rate).
This graph shows light vehicle sales since the BEA started keeping data in 1967. The dashed line is the May sales rate.
8:00 AM: Corelogic House Price index for May.
All US markets will be closed in observance of Independence Day.
7:00 AM ET: The Mortgage Bankers Association (MBA) will release the results for the mortgage purchase applications index.
8:15 AM: The ADP Employment Report for June. This report is for private payrolls only (no government). The consensus is for 188,000 payroll jobs added in June, up from 178,000 added in May.
8:30 AM: The initial weekly unemployment claims report will be released. The consensus is for 223 thousand initial claims, down from 227 thousand the previous week.
Early: Reis Q2 2018 Office Survey of rents and vacancy rates.
10:00 AM: the ISM non-Manufacturing Index for June. The consensus is for index to decrease to 58.3 from 58.6 in May.
2:00 PM: FOMC Minutes for the Meeting of June 12-13, 2018
 8:30 AM: Employment Report for June. The consensus is for an increase of 190,000 non-farm payroll jobs added in June, down from the 223,000 non-farm payroll jobs added in May.
 The consensus is for the unemployment rate to be unchanged at 3.8%.
This graph shows the year-over-year change in total non-farm employment since 1968.
In May the year-over-year change was 2.363 million jobs.
A key will be the change in wages.
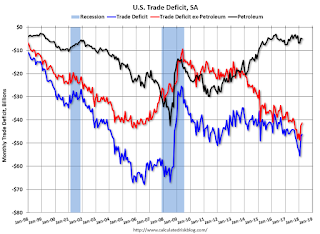
 8:30 AM: Trade Balance report for May from the Census Bureau.
 This graph shows the U.S. trade deficit, with and without petroleum, through April. The blue line is the total deficit, and the black line is the petroleum deficit, and the red line is the trade deficit ex-petroleum products.
The consensus is for the U.S. trade deficit to be at $43.5 billion in May from $46.2 billion in April.
Friday, June 29, 2018
Fannie Mae: Mortgage Serious Delinquency rate decreased in May
by Calculated Risk on 6/29/2018 04:49:00 PM
Fannie Mae reported that the Single-Family Serious Delinquency rate decreased to 1.03% in May, down from 1.09% in April. The serious delinquency rate is down from 1.04% in May 2017.
These are mortgage loans that are "three monthly payments or more past due or in foreclosure".
The Fannie Mae serious delinquency rate peaked in February 2010 at 5.59%.

By vintage, for loans made in 2004 or earlier (3% of portfolio), 3.07% are seriously delinquent. For loans made in 2005 through 2008 (6% of portfolio), 5.72% are seriously delinquent, For recent loans, originated in 2009 through 2018 (91% of portfolio), only 0.44% are seriously delinquent. So Fannie is still working through poor performing loans from the bubble years.
The recent increase in the delinquency rate was due to the hurricanes - no worries about the overall market (These are serious delinquencies, so it took three months late to be counted).
Following the hurricane bump, the rate will probably decline to 0.5 to 0.7 percent or so to a cycle bottom.
Note: Freddie Mac reported earlier.
Oil Rigs: "A lousy week for rigs"
by Calculated Risk on 6/29/2018 02:49:00 PM
A few comments from Steven Kopits of Princeton Energy Advisors LLC on June 29, 2018:
• Total oil rigs fell, -4 to 858
• Horizontal oil rigs were down, -2 to 765
...
• Rig count changes follow WTI with a lag of 9 weeks. Nine weeks ago, WTI stood at $68 / barrel, which does not seem enough to keep the rig count moving up at present
• Outside the Permian, rig counts tell a grim story of plays losing resilience
 Click on graph for larger image.
CR note: This graph shows the US horizontal rig count by basin.
Graph and comments Courtesy of Steven Kopits of Princeton Energy Advisors LLC.
Earlier: Chicago PMI Increased in June
by Calculated Risk on 6/29/2018 01:02:00 PM
From the Chicago PMI: Chicago Business Barometer Rises to 64.1 in June
The MNI Chicago Business Barometer rose 1.4 points to 64.1 in June, up from 62.7 in May, hitting the highest level since January.This was above the consensus forecast of 60.1, and a strong reading.
Business activity expanded at a faster pace in June, with firms’ operations up for a third consecutive month. Four of the five Barometer components strengthened on the month, leaving the Barometer up 0.8% on the year.
...
This month, two special questions were posed to firms. The first asked whether ongoing trade talks were having an impact on short-term purchasing decisions. Just under a quarter said that they were having a significant impact on business while an additional 39.2% said yes but only to a minimal extent up until now. Just 17.7% said they had been immune to any disruptions, with the remaining 19.6% unsure.
The second question asked firms if they had increased starting salaries to attract and secure prospective employees. The majority of firms, at 61.4%, said that had yet to resort to this measure but a fairly sizeable 38.6% said that this was a strategy which they had turned to.
“Stronger outturns in May and June left the MNI Chicago Business Barometer broadly unchanged in Q2, running at a pace similar to that seen throughout 2017. While impressive, supply-side frustrations are undermining firms’ productive capacity,” said Jamie Satchi, Economist at MNI Indicators.
“Confusion surrounding the trade landscape continues to breed uncertainty among businesses and their suppliers and has led to many firms’ altering their immediate purchasing decisions,” he added.
emphasis added
Q2 GDP Forecasts
by Calculated Risk on 6/29/2018 11:18:00 AM
From Merrill Lynch:
The data sliced 0.4pp from 2Q GDP tracking, bringing our estimate down to 3.6% qoq saar. [June 29 estimate].And from the Altanta Fed: GDPNow
emphasis added
The GDPNow model estimate for real GDP growth (seasonally adjusted annual rate) in the second quarter of 2018 is 3.8 percent on June 29, down from 4.5 percent on June 27. [June 29 estimate]From the NY Fed Nowcasting Report
The New York Fed Staff Nowcast stands at 2.8% for 2018:Q2 and 2.5% for 2018:Q3. [June 29 estimate]CR Note: These estimates suggest real annualized GDP in the 2.8% to 3.8% range in Q2.
Personal Income increased 0.4% in May, Spending increased 0.2%
by Calculated Risk on 6/29/2018 08:36:00 AM
The BEA released the Personal Income and Outlays report for May:
Personal income increased $60.0 billion (0.4 percent) in May according to estimates released today by the Bureau of Economic Analysis. Disposable personal income (DPI) increased $63.2 billion (0.4 percent) and personal consumption expenditures (PCE) increased $27.8 billion (0.2 percent).The May PCE price index increased 2.3 percent year-over-year (up from 2.0 percent YoY in April) and the May PCE price index, excluding food and energy, increased 2.0 percent year-over-year (up from 1.8 percent YoY in April).
Real DPI increased 0.2 percent in May and Real PCE decreased less than 0.1 percent. The PCE price index increased 0.2 percent. Excluding food and energy, the PCE price index increased 0.2 percent.
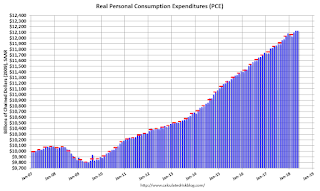
The following graph shows real Personal Consumption Expenditures (PCE) through May 2018 (2009 dollars). Note that the y-axis doesn't start at zero to better show the change.
 Click on graph for larger image.
The dashed red lines are the quarterly levels for real PCE.
The increase in personal income was at expectations, and the increase in PCE was below expectations.
Using the two-month method to estimate Q2 PCE growth, PCE was increasing at a 3.0% annual rate in Q2 2018. (using the mid-month method, PCE was increasing 3.4%). This suggests decent PCE growth in Q2, but below expectations. (Estimates for Q2 GDP will be revised down).
Thursday, June 28, 2018
Friday: Personal Income and Outlays, Chicago PMI
by Calculated Risk on 6/28/2018 07:03:00 PM
Friday:
• At 8:30 AM ET, Personal Income and Outlays for May. The consensus is for a 0.4% increase in personal income, and for a 0.4% increase in personal spending. And for the Core PCE price index to increase 0.2%.
• At 9:45 AM, Chicago Purchasing Managers Index for June. The consensus is for a reading of 60.1, down from 62.7 in May.
• At 10:00 AM, University of Michigan's Consumer sentiment index (Final for June). The consensus is for a reading of 99.2, down from 99.3.
Zillow Case-Shiller Forecast: Slower House Price Gains in May
by Calculated Risk on 6/28/2018 04:11:00 PM
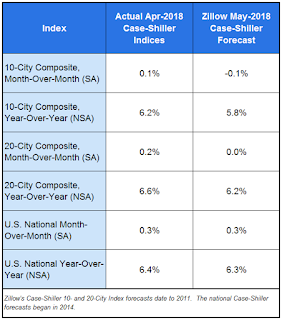
The Case-Shiller house price indexes for April were released Tuesday. Zillow forecasts Case-Shiller a month early, and I like to check the Zillow forecasts since they have been pretty close.
From Aaron Terrazas at Zillow: April Case-Shiller Results and May Forecast: The New Normal
In a normal housing market, there is almost always a decently balanced pool of winners and losers. But as severely limited inventory continues to help push up home prices at a rapid clip, it’s clear that current housing trends are far from normal – and that there are a lot more losers right now than winners.The Zillow forecast is for the year-over-year change for the Case-Shiller National index to be larger in March than in February.
The U.S. National Case-Shiller Index rose 6.4 percent in April from a year ago, largely in line with expectations. April was the eighth straight month of annual appreciation of 6 percent or higher, and the longest such streak since a stretch of 19 months of breakneck appreciation that began in December 2012 as the housing market began to bounce back in earnest from the depths of the recession. Over the past 30-plus years, dating to January 1988, annual U.S. home price growth as measured by the Case Shiller National Index has averaged 3.8 percent.
...
Looking ahead, rapid home value growth may slow somewhat, although not likely by much to make a difference in the underlying trends of high demand and low supply that are driving the market right now. Zillow expects the U.S. National Index to grow by 6.3 percent in May from a year ago, down only slightly from April. The 10- and 20-city indices are likely to slow down further. Full Case-Shiller data for May is scheduled for release Tuesday, July 31.


