by Calculated Risk on 8/07/2018 12:59:00 PM
Tuesday, August 07, 2018
U.S. Heavy Truck Sales up 13% Year-over-year in July
The following graph shows heavy truck sales since 1967 using data from the BEA. The dashed line is the July 2018 seasonally adjusted annual sales rate (SAAR).
Heavy truck sales really collapsed during the great recession, falling to a low of 181 thousand in April and May 2009, on a seasonally adjusted annual rate basis (SAAR). Then sales increased more than 2 1/2 times, and hit 480 thousand SAAR in June 2015.
Heavy truck sales declined again - probably mostly due to the weakness in the oil sector - and bottomed at 364 thousand SAAR in October 2016.
Click on graph for larger image.
With the increase in oil prices over the last year, heavy truck sales increased too.
Heavy truck sales were at 464 thousand SAAR in July, down from 485 thousand SAAR in June, and up from 409 thousand SAAR in July 2017.
BLS: Job Openings "Little Changed" in June
by Calculated Risk on 8/07/2018 10:07:00 AM
Notes: In June there were 6.662 million job openings, and, according to the June Employment report, there were 6.564 million unemployed. So, for the third consecutive month, there were more job openings than people unemployed. Also note that the number of job openings has exceeded the number of hires since January 2015.
From the BLS: Job Openings and Labor Turnover Summary
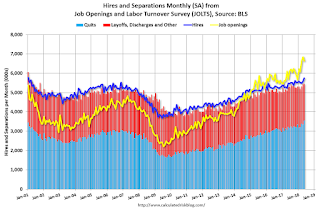
The number of job openings was little changed at 6.7 million on the last business day of June, the U.S. Bureau of Labor Statistics reported today. Over the month, hires and separations were little changed at 5.7 million and 5.5 million, respectively. Within separations, the quits rate was unchanged at 2.3 percent and the layoffs and discharges rate was little changed at 1.2 percent. ...The following graph shows job openings (yellow line), hires (dark blue), Layoff, Discharges and other (red column), and Quits (light blue column) from the JOLTS.
The number of quits was little changed in June at 3.4 million. The quits rate was 2.3 percent. The number of quits was little changed for total private and for government.
emphasis added
This series started in December 2000.
Note: The difference between JOLTS hires and separations is similar to the CES (payroll survey) net jobs headline numbers. This report is for June, the most recent employment report was for July.
 Click on graph for larger image.
Note that hires (dark blue) and total separations (red and light blue columns stacked) are pretty close each month. This is a measure of labor market turnover. When the blue line is above the two stacked columns, the economy is adding net jobs - when it is below the columns, the economy is losing jobs.
Jobs openings increased slightly in June to 6.662 million from 6.659 million in May.
The number of job openings (yellow) are up 9% year-over-year.
Quits are up 7% year-over-year. These are voluntary separations. (see light blue columns at bottom of graph for trend for "quits").
Job openings are at a high level, and quits are increasing year-over-year. This was a strong report.
CoreLogic: House Prices up 6.8% Year-over-year in June
by Calculated Risk on 8/07/2018 08:57:00 AM
Notes: This CoreLogic House Price Index report is for June. The recent Case-Shiller index release was for May. The CoreLogic HPI is a three month weighted average and is not seasonally adjusted (NSA).
From CoreLogic: CoreLogic Reports June Home Prices Increased by 6.8 Percent, Millennials Identify Affordability as Biggest Hurdle
CoreLogic® ... today released the CoreLogic Home Price Index (HPI™) and HPI Forecast™ for June 2018, which shows home prices rose both year over year and month over month. Home prices increased nationally by 6.8 percent year over year from June 2017 to June 2018. On a month-over-month basis, prices increased by 0.7 percent in June 2018 compared with May 2018, according to the CoreLogic HPI.CR Note: The CoreLogic YoY increase has been in the 5% to 7% range for the last few years. This is near the top end of that range. The year-over-year comparison has been positive for over six consecutive years since turning positive year-over-year in February 2012.
Looking ahead, the CoreLogic HPI Forecast indicates that the national home-price index is projected to continue to increase by 5.1 percent on a year-over-year basis from June 2018 to June 2019. On a month-over-month basis, home prices are expected to be flat from June to July 2018. The CoreLogic HPI Forecast is a projection of home prices that is calculated using the CoreLogic HPI and other economic variables. Values are derived from state-level forecasts by weighting indices according to the number of owner-occupied households for each state.
“The rise in home prices and interest rates over the past year have eroded affordability and are beginning to slow existing home sales in some markets,” said Dr. Frank Nothaft, chief economist for CoreLogic. “For June, we found in CoreLogic public records data that home sales in the San Francisco Bay Area and Southern California were down 9 and 12 percent, respectively, from one year earlier. Further increases in home prices and mortgage rates over the next year will likely dampen sales and home-price growth.”
emphasis added
Monday, August 06, 2018
Tuesday: Job Openings
by Calculated Risk on 8/06/2018 07:43:00 PM
From Matthew Graham at Mortgage News Daily: Mortgage Rates Drift Modestly Lower
Mortgage rates were slightly lower for the 3rd straight business day, but not for any particular reason. Because of the relatively narrow range, rates are now technically as low as they've been since July 25th for the average lender. [30YR FIXED - 4.625% - 4.75%]Tuesday:
emphasis added
• At 10:00 AM ET, Job Openings and Labor Turnover Survey for June from the BLS. Jobs openings decreased in May to 6.638 million from 6.840 million in April.
• At 3:00 PM, Consumer Credit from the Federal Reserve. The consensus is for consumer credit to increase $16.0 billion in June.
Annual Vehicle Sales: On Pace to decline slightly in 2018
by Calculated Risk on 8/06/2018 12:01:00 PM
The BEA released their estimate of July vehicle sales. The BEA estimated sales of 16.68 million SAAR in July 2018 (Seasonally Adjusted Annual Rate), down 3.1% from the June sales rate, and down slightly from July 2017.
Through July, light vehicle sales are on pace to be down slightly in 2018 compared to 2017.
This would make 2018 the sixth best year on record after 2016, 2015, 2000, 2017 and 2001.
My guess is vehicle sales will finish the year with sales lower than in 2017 (sales in late 2017 were boosted by buying following the hurricanes). A small decline in sales this year isn't a concern - I think sales will move mostly sideways at near record levels.
As I noted last year, this means the economic boost from increasing auto sales is over (from the bottom in 2009, auto sales boosted growth every year through 2016).
Click on graph for larger image.
This graph shows annual light vehicle sales since 1976. Source: BEA.
Sales for 2018 are estimated based on the pace of sales during the first seven months.
Update: Framing Lumber Prices Fall from Record Highs, Up 20% Year-over-year
by Calculated Risk on 8/06/2018 10:13:00 AM
Here is another monthly update on framing lumber prices. Lumber prices declined in July from the recent record highs, but are still up sharply year-over-year.
This graph shows two measures of lumber prices: 1) Framing Lumber from Random Lengths through July 27, 2018 (via NAHB), and 2) CME framing futures.

Right now Random Lengths prices are up 15% from a year ago, and CME futures are up about 23% year-over-year.
There is a seasonal pattern for lumber prices. Prices frequently peak around May, and bottom around October or November - although there is quite a bit of seasonal variability.
Tariffs on lumber, steel and aluminum are impacting housing costs. And rising costs - both material and labor - are headwinds for the building industry this year.
AAR: July Rail Carloads Up 3.5% YoY, Intermodal Up 6.9% YoY
by Calculated Risk on 8/06/2018 08:11:00 AM
From the Association of American Railroads (AAR) Rail Time Indicators. Graphs and excerpts reprinted with permission.
All things considered, U.S. rail traffic did well in July 2018. Total originated carloads were up 3.5%, or 35,208 carloads, compared with July 2017. That’s the fifth straight year-over-year monthly gain.
…
Intermodal volume in July on U.S. railroads was up 6.9%, the largest percentage increase in 19 months. 2018 will be another record year for intermodal.
 Click on graph for larger image.
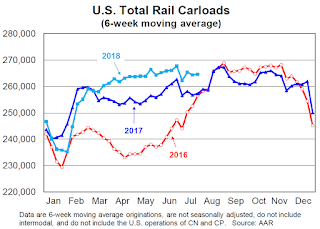
This graph from the Rail Time Indicators report shows U.S. average weekly rail carloads (NSA). Light blue is 2018.
Rail carloads have been weak over the last decade due to the decline in coal shipments.
U.S. railroads originated 1,048,293 carloads in July 2018, up 3.5%, or 35,208 carloads, over July 2017. Weekly average total carloads were 262,073 in July 2018, the most for July since 2015. July’s 3.5% gain is the fifth straight year-over-year monthly increase; four of those increases were more than 3%.
 The second graph is for intermodal traffic (using intermodal or shipping containers):
U.S. intermodal originations totaled 1,108,142 containers and trailers in July 2018, up 6.9%, or 71,782 units, over July 2017. Average weekly intermodal volume in July 2018 was 277,036 units, easily the most ever for July.
Sunday, August 05, 2018
Sunday Night Futures
by Calculated Risk on 8/05/2018 08:11:00 PM
Weekend:
• Schedule for Week of Aug 5, 2018
Monday:
• No major economic releases scheduled.
From CNBC: Pre-Market Data and Bloomberg futures: S&P 500 and DOW futures are mostly unchanged (fair value).
Oil prices were down over the last week with WTI futures at $68.49 per barrel and Brent at $73.21 per barrel. A year ago, WTI was at $50, and Brent was at $52 - so oil prices are up 40% year-over-year.
Here is a graph from Gasbuddy.com for nationwide gasoline prices. Nationally prices are at $2.86 per gallon. A year ago prices were at $2.34 per gallon - so gasoline prices are up 52 cents per gallon year-over-year.
Employment: July Diffusion Indexes
by Calculated Risk on 8/05/2018 11:53:00 AM
I haven't posted this in a few months.
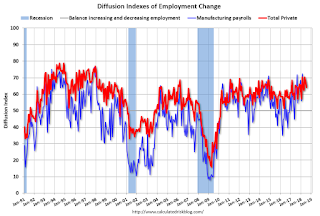
The BLS diffusion index for total private employment was at 64.0 in July, down from 67.4 in June.
For manufacturing, the diffusion index was at 65.1, down from 67.8 in June.
Note: Any reading above 60 is very good.
Think of this as a measure of how widespread job gains are across industries. The further from 50 (above or below), the more widespread the job losses or gains reported by the BLS. From the BLS:
Figures are the percent of industries with employment increasing plus one-half of the industries with unchanged employment, where 50 percent indicates an equal balance between industries with increasing and decreasing employment.
 Overall both total private and manufacturing job growth was widespread again in July.
Saturday, August 04, 2018
Schedule for Week of August 5, 2018
by Calculated Risk on 8/04/2018 08:11:00 AM
The key economic report this week is the July Consumer Price Index (CPI) on Friday.
No major economic releases scheduled.
 10:00 AM ET: Job Openings and Labor Turnover Survey for June from the BLS.
 This graph shows job openings (yellow line), hires (purple), Layoff, Discharges and other (red column), and Quits (light blue column) from the JOLTS.
Jobs openings decreased in May to 6.638 million from 6.840 million in April.
The number of job openings (yellow) were up 16.7% year-over-year, and Quits were up 10.4% year-over-year.
3:00 PM: Consumer Credit from the Federal Reserve. The consensus is for consumer credit to increase $16.0 billion in June.
7:00 AM ET: The Mortgage Bankers Association (MBA) will release the results for the mortgage purchase applications index.
8:30 AM: The initial weekly unemployment claims report will be released. The consensus is for 220 thousand initial claims, up from 218 thousand the previous week.
8:30 AM: The Producer Price Index for July from the BLS. The consensus is a 0.3% increase in PPI, and a 0.3% increase in core PPI.
8:30 AM: The Consumer Price Index for July from the BLS. The consensus is for a 0.2% increase in CPI, and a 0.2% increase in core CPI.


