by Calculated Risk on 9/16/2018 07:54:00 PM
Sunday, September 16, 2018
Sunday Night Futures
Weekend:
• Schedule for Week of September 16, 2018
Monday:
• At 8:30 AM ET, The New York Fed Empire State manufacturing survey for September. The consensus is for a reading of 23.0, down from 25.6.
From CNBC: Pre-Market Data and Bloomberg futures: S&P 500 are down 5 and DOW futures are down 45 (fair value).
Oil prices were up over the last week with WTI futures at $68.79 per barrel and Brent at $77.96 per barrel. A year ago, WTI was at $50, and Brent was at $56 - so oil prices are up about 40% year-over-year.
Here is a graph from Gasbuddy.com for nationwide gasoline prices. Nationally prices are at $2.85 per gallon. A year ago prices were at $2.60 per gallon (jumped last year due to hurricane Harvey) - so gasoline prices are up 25 cents per gallon year-over-year.
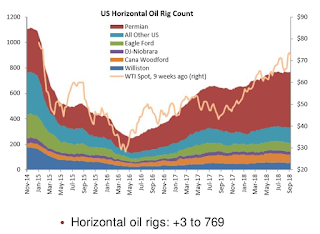
Oil Rigs: "Treading water"
by Calculated Risk on 9/16/2018 08:12:00 AM
A few comments from Steven Kopits of Princeton Energy Advisors LLC on September 14, 2018:
• Oil rigs gained, +7 to 867
• Horizontal oil rigs were up, +3 to 769
...
• Horizontal oil rigs counts are essentially unchanged in 13 weeks
• The Permian has been flat for six weeks, and is only 4 horizontal oil rigs higher than three months ago.
• The breakeven oil price to add horizontal oil rigs came in at $72 WTI this week. This is a good bit higher than the current WTI price around $69.
 Click on graph for larger image.
CR note: This graph shows the US horizontal rig count by basin.
Graph and comments Courtesy of Steven Kopits of Princeton Energy Advisors LLC.
Saturday, September 15, 2018
Schedule for Week of September 16, 2018
by Calculated Risk on 9/15/2018 08:11:00 AM
The key economic reports this week are August Housing Starts and Existing Home Sales.
For manufacturing, the September New York and Philly Fed surveys, will be released this week.
8:30 AM ET: The New York Fed Empire State manufacturing survey for September. The consensus is for a reading of 23.0, down from 25.6.
10:00 AM: The September NAHB homebuilder survey. The consensus is for a reading of 67, unchanged from 67 in August. Any number above 50 indicates that more builders view sales conditions as good than poor.
7:00 AM ET: The Mortgage Bankers Association (MBA) will release the results for the mortgage purchase applications index.
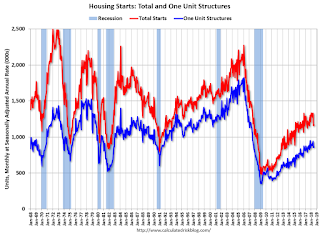
 8:30 AM: Housing Starts for August.
 This graph shows single and total housing starts since 1968.
The consensus is for 1.240 million SAAR, up from 1.168 million SAAR.
During the day: The AIA's Architecture Billings Index for August (a leading indicator for commercial real estate).
8:30 AM: The initial weekly unemployment claims report will be released. The consensus is for 210 thousand initial claims, up from 204 thousand the previous week.
8:30 AM: the Philly Fed manufacturing survey for September. The consensus is for a reading of 19.2, up from 11.9.
 10:00 AM: Existing Home Sales for August from the National Association of Realtors (NAR). The consensus is for 5.36 million SAAR, up from 5.34 million in July.
The graph shows existing home sales from 1994 through the report last month.
12:00 PM: Q2 Flow of Funds Accounts of the United States from the Federal Reserve.
10:00 AM: State Employment and Unemployment (Monthly) for August 2018
Friday, September 14, 2018
Lawler: Single Family Rental Market Share Shrunk Significantly in 2017
by Calculated Risk on 9/14/2018 07:34:00 PM
From housing economist Tom Lawler: Single Family Rental Market Share Shrunk Significantly in 2017
ACS estimates suggest that the renter-occupied share of total occupied single-family detached homes fell to 16.13% in 2017 from 16.76% in 2016. This renter share was the lowest since 2011.
The ACS estimate of the number of renter-occupied single-family detached homes in 2017 was 12,172,265, down 294,869 from 2016.
Lawler: Household Estimates Conundrum Alive and Well
by Calculated Risk on 9/14/2018 04:22:00 PM
From housing economist Tom Lawler: Household Estimates Conundrum Alive and Well
One of the most vexing government data issues facing housing economists is the lack of any timely and reliable estimates of the number of US households. To be sure, there is no shortage of household estimates: in addition to the decennial Census counts, Census releases four different estimates of the number of US households. Unfortunately, the estimates not only differ materially, but also show different characteristics of households (e.g., by age) and often show different growth rates over time.
This issue, labeled by Census economists several years ago as the “household estimates conundrum,” was highlighted in the recent release of US household estimates from the 2017 American Community Survey (ACS), the 2017 American Housing Survey (AHS), and the 2018 (March) Current Population Survey Annual Social and Economic Supplement (CPS/ASEC). Below is a table showing estimates of the number of US households by age group from each of these surveys, as well as 2017 estimates from the Housing Vacancy Survey, a monthly supplement to the Current Population Survey.
| Different Estimates of the Number of US Households by Select Age Groups (000's) | |||||
|---|---|---|---|---|---|
| ACS 2017 | AHS 2017 | HVS 2017 | CPS/ASEC March 2018 | CPS/ASEC March 2017 | |
| Total | 120,063 | 121,190 | 119,273 | 127,586 | 126,224 |
| 15-24 | 4,334 | 4,274 | 5,932 | 6,211 | 6,239 |
| 25-34 | 18,107 | 17,716 | 19,399 | 20,264 | 20,109 |
| 35-44 | 20,553 | 20,740 | 20,051 | 21,576 | 21,500 |
| 45-54 | 22,671 | 23,220 | 21,387 | 22,542 | 22,808 |
| 55-64 | 23,705 | 24,690 | 22,551 | 24,020 | 23,770 |
| 65+ | 30,692 | 30,550 | 29,953 | 32,973 | 31,798 |
None of these surveys is designed directly to measure the number of households; rather, they are designed to estimate the characteristics of the household population and/or the housing stock. Household estimates are then “controlled” either to independent US population estimates (CPS/ASEC) or to independent US housing stock estimates (ACS, AHS, and HVS).
If the housing stock estimates are correct but a survey overstates the overall vacancy rate, and that survey is controlled to housing stock estimates, then that survey will understate the number of households. If the population estimates are correct but the survey understates the average US household size, then that survey will overstate the number of households. Comparisons of survey estimates with decennial Census 2010 counts indicated that the ACS and HVS understated the number of US households, and the CPS/ASEC overstated the number of US households.
Aside from the total estimates, what is especially striking about the different survey results is the vastly different age distributions of households. For example, the CPS-based household estimates show that the share of US households under 35 years old is about 21%, compared to the ACS’s 18.7% and the AHS’s 18.1%. Comparisons of the surveys to Decennial Census counts showed that CPS-based household estimates significantly overstated the number of younger householders, while the ACS understated somewhat the number of younger householders.
The issue of differences in household and vacancy rate estimates was a “hot topic” following the release of Census 2010 results, and there was a flurry of working papers earlier this decade on the topic (though the papers only focused on differences in Census 2010 and the 2010 ACS, even though CPS-based differences were even larger. Since 2013, however, research appears to have stalled, which is disturbing.
Q3 GDP Forecasts
by Calculated Risk on 9/14/2018 11:37:00 AM
From Merrill Lynch:
3Q GDP tracking received a 0.5pp boost from this morning's data, leaving us at 3.7%. 2Q remains at 4.4%. [Sept 14 estimate].And from the Altanta Fed: GDPNow
emphasis added
The GDPNow model estimate for real GDP growth (seasonally adjusted annual rate) in the third quarter of 2018 is 4.4 percent on September 14, up from 3.8 percent on September 11. [Sept 14 estimate]From the NY Fed Nowcasting Report
The New York Fed Staff Nowcast stands at 2.2% for 2018:Q3 and 2.8% for 2018:Q4. [Sept 14 estimate]CR Note: It looks like GDP will be in the 3s in Q3.
Industrial Production Increased 0.4% in August
by Calculated Risk on 9/14/2018 09:22:00 AM
From the Fed: Industrial Production and Capacity Utilization
Industrial production rose 0.4 percent in August for its third consecutive monthly increase. Manufacturing output moved up 0.2 percent on the strength of a 4.0 percent rise for motor vehicles and parts; motor vehicle assemblies jumped to an annual rate of 11.5 million units, the strongest reading since April. Excluding the gain in motor vehicles and parts, factory output was unchanged. The output of utilities advanced 1.2 percent, and mining production increased 0.7 percent; the index for mining last decreased in January. At 108.2 percent of its 2012 average, total industrial production was 4.9 percent higher in August than it was a year earlier. Capacity utilization for the industrial sector moved up in August to 78.1 percent, a rate that is 1.7 percentage points below its long-run (1972–2017) average.
emphasis added
 Click on graph for larger image.
This graph shows Capacity Utilization. This series is up 11.4 percentage points from the record low set in June 2009 (the series starts in 1967).
Capacity utilization at 78.1% is 1.7% below the average from 1972 to 2017 and below the pre-recession level of 80.8% in December 2007.
Note: y-axis doesn't start at zero to better show the change.
 The second graph shows industrial production since 1967.
Industrial production increased in August to 108.2. This is 24% above the recession low, and 3% above the pre-recession peak.
The increase in industrial production was at the consensus forecast - however July was revised down, and capacity utilization was below consensus.
Retail Sales increased 0.1% in August
by Calculated Risk on 9/14/2018 08:38:00 AM
On a monthly basis, retail sales increased 0.1 percent from July to August (seasonally adjusted), and sales were up 6.6 percent from August 2017.
From the Census Bureau report:
Advance estimates of U.S. retail and food services sales for August 2018, adjusted for seasonal variation and holiday and trading-day differences, but not for price changes, were $509.0 billion, an increase of 0.1 percent from the previous month, and 6.6 percent above August 2017. Total sales for the June 2018 through August 2018 period were up 6.5 percent from the same period a year ago. The June 2018 to July 2018 percent change was revised from up 0.5 percent to up 0.7 percent.
 Click on graph for larger image.
This graph shows retail sales since 1992. This is monthly retail sales and food service, seasonally adjusted (total and ex-gasoline).
Retail sales ex-gasoline were down 0.1% in August.
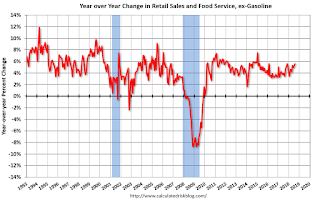
The second graph shows the year-over-year change in retail sales and food service (ex-gasoline) since 1993.
 Retail and Food service sales, ex-gasoline, increased by 5.6% on a YoY basis.
The increase in August was well below expectations, however sales in June and July were revised up.
Thursday, September 13, 2018
Friday: Retail Sales, Industrial Production
by Calculated Risk on 9/13/2018 06:44:00 PM
Friday:
• At 8:30 AM ET, Retail sales for August will be released. The consensus is for a 0.4% increase in retail sales.
• At 9:15 AM, The Fed will release Industrial Production and Capacity Utilization for August. The consensus is for a 0.4% increase in Industrial Production, and for Capacity Utilization to increase to 78.3%.
• At 10:00 AM, University of Michigan's Consumer sentiment index (Preliminary for September).
Housing Inventory Tracking
by Calculated Risk on 9/13/2018 03:38:00 PM
Update: Watching existing home "for sale" inventory is very helpful. As an example, the increase in inventory in late 2005 helped me call the top for housing.
And the decrease in inventory eventually helped me correctly call the bottom for house prices in early 2012, see: The Housing Bottom is Here.
And in 2015, it appeared the inventory build in several markets was ending, and that boosted price increases.
I don't have a crystal ball, but watching inventory helps understand the housing market.
Inventory, on a national basis, was unchanged year-over-year (YoY) in July, this followed 37 consecutive months with a YoY decline.
The graph below shows the YoY change for non-contingent inventory in Houston, Las Vegas, Sacramento (through August) and also Phoenix (through July) and total existing home inventory as reported by the NAR (through July).

This shows the YoY change in inventory for Houston, Las Vegas, Phoenix, and Sacramento. The black line is the year-over-year change in inventory as reported by the NAR.
Note that inventory in Sacramento was up 22% year-over-year in July (inventory was still very low), and has increased YoY for eleven consecutive months.
Also note that inventory was up 20% YoY in Las Vegas in August (red), the second consecutive month with a YoY increase.
Houston is a special case, and inventory was up for several years due to lower oil prices, but declined YoY recently as oil prices increased. Inventory was up slightly in Houston in August (but the YoY change might be distorted by Hurricane Harvey last year).
Inventory is a key for the housing market, and I am watching inventory for the impact of the new tax law and higher mortgage rates on housing. I expect national inventory will be up YoY at the end of 2018 (but still be low).
This is not comparable to late 2005 when inventory increased sharply signaling the end of the housing bubble, but it does appear that inventory is bottoming nationally (but still very low).


