by Calculated Risk on 3/02/2019 08:11:00 AM
Saturday, March 02, 2019
Schedule for Week of March 3, 2019
The key reports scheduled for this week are the February employment report, December New Home Sales, and January Housing Starts (Some more catching up).
Other key reports scheduled for this week are the trade deficit and February vehicle sales.
Fed Chair Jerome Powell will speak on Friday about Monetary Policy Normalization.
 All day: Light vehicle sales for February. The consensus is for light vehicle sales to be 17.0 million SAAR in February, down from 16.6 million in January (Seasonally Adjusted Annual Rate).
This graph shows light vehicle sales since the BEA started keeping data in 1967. The dashed line is the January sales rate.
10:00 AM: Construction Spending for December. The consensus is for a 0.6% increase in construction spending.
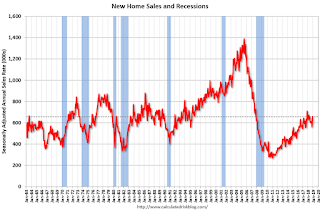 10:00 AM: New Home Sales for December from the Census Bureau.
 This graph shows New Home Sales since 1963. The dashed line is the sales rate for last month.
The consensus is for 591 thousand SAAR, down from 657 thousand in November.
10:00 AM: Corelogic House Price index for January.
10:00 AM: the ISM non-Manufacturing Index for February.
7:00 AM ET: The Mortgage Bankers Association (MBA) will release the results for the mortgage purchase applications index.
8:15 AM: The ADP Employment Report for February. This report is for private payrolls only (no government). The consensus is for 180,000 payroll jobs added in February, down from 213,000 added in January.
 8:30 AM: Trade Balance report for December from the Census Bureau.
 This graph shows the U.S. trade deficit, with and without petroleum, through the most recent report. The blue line is the total deficit, and the black line is the petroleum deficit, and the red line is the trade deficit ex-petroleum products.
The consensus is the trade deficit to be $57.6 billion. The U.S. trade deficit was at $49.3 billion in November.
2:00 PM: the Federal Reserve Beige Book, an informal review by the Federal Reserve Banks of current economic conditions in their Districts.
8:30 AM: The initial weekly unemployment claims report will be released. The consensus is for 225 thousand initial claims, unchanged from 225 thousand the previous week.
12:00 PM: Q4 Flow of Funds Accounts of the United States from the Federal Reserve.
3:00 PM: Consumer Credit from the Federal Reserve.
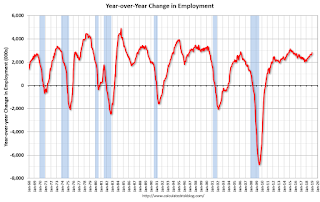 8:30 AM: Employment Report for February. The consensus is for 178,000 jobs added, and for the unemployment rate to decline to 3.9%.
There were 304,000 jobs added in January, and the unemployment rate was at 4.0%.
This graph shows the year-over-year change in total non-farm employment since 1968.
In January the year-over-year change was 2.807 million jobs.
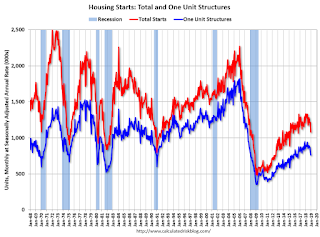 8:30 AM ET: Housing Starts for January.
 This graph shows single and total housing starts since 1968.
The consensus is for 1.170 million SAAR, up from 1.078 million SAAR.
10:00 PM: Speech by Fed Chair Jerome Powell, Monetary Policy Normalization and Review, At the 2019 Stanford Institute for Economic Policy Research (SIEPR) Economic Summit, Stanford, California
Friday, March 01, 2019
Demographics: Renting vs. Owning
by Calculated Risk on 3/01/2019 03:52:00 PM
Note; This is an update to a post I wrote in 2015.
It was almost 9 years ago that we started discussing the turnaround for apartments. Then, in January 2011, I attended the NMHC Apartment Strategies Conference in Palm Springs, and the atmosphere was very positive.
The drivers in 2011 were 1) very low new supply for apartments, and 2) strong demand (both favorable demographics, and people moving from owning to renting).
The move "from owning to renting" is over, and demographics for apartments are much less favorable than 8 years ago. Also much more supply has come online. Slowing demand and more supply for apartments is why multi-family starts have slowed recently (multi-family starts probably peaked in 2015).
| Multi-family Starts by Year | |
|---|---|
| Year | 5+ Units (000s) |
| 2005 | 311.4 |
| 2006 | 292.8 |
| 2007 | 277.3 |
| 2008 | 266.0 |
| 2009 | 97.3 |
| 2010 | 104.3 |
| 2011 | 167.3 |
| 2012 | 233.9 |
| 2013 | 293.7 |
| 2014 | 341.7 |
| 2015 | 385.8 |
| 2016 | 380.8 |
| 2017 | 342.7 |
| 2018 | 359.7 |
On demographics, a large cohort had been moving into the 20 to 29 year old age group (a key age group for renters). Going forward, a large cohort is moving into the 30 to 39 age group (a key for ownership).
Note: Household formation would be a better measure than population, but reliable data for households is released with a long lag.
NOTE: This graph is updated using the Vintage 2017 estimates.
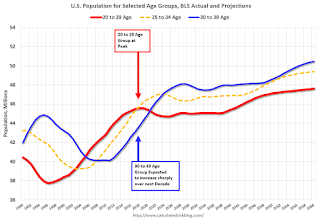 Click on graph for larger image.
This graph shows the longer term trend for three key age groups: 20 to 29, 25 to 34, and 30 to 39 (the groups overlap).
This graph is from 1990 to 2060 (all data from BLS: current to 2060 is projected).
We can see the surge in the 20 to 29 age group (red). Once this group exceeded the peak in earlier periods, there was an increase in apartment construction. This age group peaked in 2018 / 2019 (until the 2030s), and the 25 to 34 age group (orange, dashed) will peak around 2023. This suggests demand for apartments will soften somewhat.
For buying, the 30 to 39 age group (blue) is important (note: see Demographics and Behavior for some reasons for changing behavior). The population in this age group is increasing, and will increase significantly over the next decade.
This demographics is now positive for home buying, and this is a key reason I expect single family housing starts to continue to increase.
Q1 GDP Forecasts: Starting Low
by Calculated Risk on 3/01/2019 12:09:00 PM
From Merrill Lynch:
Following 4Q GDP, we revise down 1Q 2019 growth to 1.0% from 1.5%. The revision largely reflects greater drag from inventories, with some adjustments to other components [Mar 1 estimate]From the NY Fed Nowcasting Report.
emphasis added
The Q1 2019 nowcast is for 0.9% real GDP growth (Mar 1 estimate).
And from the Altanta Fed: GDPNow
The initial GDPNow model estimate for real GDP growth (seasonally adjusted annual rate) in the first quarter of 2019 is 0.3 percent on March 1. [Mar 1 estimate]CR Note: These very early estimates suggest GDP around 1% in Q1.
ISM Manufacturing index Decreased to 54.2 in February
by Calculated Risk on 3/01/2019 10:04:00 AM
The ISM manufacturing index indicated expansion in February. The PMI was at 54.2% in February, down from 56.6% in January. The employment index was at 52.3%, down from 55.5% last month, and the new orders index was at 55.5%, down from 58.2%.
From the Institute for Supply Management: February 2019 Manufacturing ISM® Report On Business®
Economic activity in the manufacturing sector expanded in February, and the overall economy grew for the 118th consecutive month, say the nation’s supply executives in the latest Manufacturing ISM® Report On Business®.
The report was issued today by Timothy R. Fiore, CPSM, C.P.M., Chair of the Institute for Supply Management® (ISM®) Manufacturing Business Survey Committee: “The February PMI® registered 54.2 percent, an decrease of 2.4 percentage points from the January reading of 56.6 percent. The New Orders Index registered 55.5 percent, a decrease of 2.7 percentage points from the January reading of 58.2 percent. The Production Index registered 54.8 percent, 5.7-percentage point decrease compared to the January reading of 60.5 percent. The Employment Index registered 52.3 percent, a decrease of 3.2 percentage points from the January reading of 55.5 percent. The Supplier Deliveries Index registered 54.9 percent, a 1.3 percentage point decrease from the January reading of 56.2 percent. The Inventories Index registered 53.4 percent, an increase of 0.6 percentage point from the January reading of 52.8 percent. The Prices Index registered 49.4 percent, a 0.2-percentage point decrease from the January reading of 49.6 percent, indicating lower raw materials prices for the second straight month after nearly three years of increases.
emphasis added
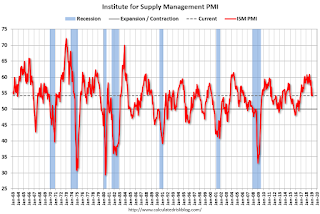 Click on graph for larger image.
Here is a long term graph of the ISM manufacturing index.
This was below expectations of 55.0%, and suggests manufacturing expanded at a slower pace in February than in January.
Personal Income decreased 0.1% in January, increased 1.0% in December
by Calculated Risk on 3/01/2019 08:42:00 AM
The BEA released the Personal Income and Outlays report for December, and Personal income for January:
Due to the recent partial government shutdown, this report combines estimates for December 2018 and January 2019. December estimates include both income and outlays measures, while January estimates are limited to personal income. Estimates of outlays for January are unavailable due to a delay in the release of the Census Bureau’s Advance Monthly Retail Sales.The increase in personal income for December was above expectations, however the change in personal income for January was well below consensus. The increase in core PCE was at expectations.
Personal income increased $179.0 billion (1.0 percent) in December according to estimates released today by the Bureau of Economic Analysis. Disposable personal income increased $173.1 billion (1.1 percent), and personal consumption expenditures decreased $76.6 billion (-0.5 percent).
Real DPI increased 1.0 percent in December and real PCE decreased 0.6 percent. The PCE price index increased 0.1 percent. Excluding food and energy, the PCE price index increased 0.2 percent.
...
Personal income decreased $23.8 billion (-0.1 percent) in January. Disposable personal income (DPI) decreased $35.1 billion (-0.2 percent); Real DPI is unavailable for January.
Thursday, February 28, 2019
Friday: Personal Income and Outlays, ISM Manufacturing
by Calculated Risk on 2/28/2019 09:30:00 PM
Friday:
• At 8:30 AM ET, Personal Income and Outlays for December, and Personal Income for January. The consensus is for a 0.4% increase in personal income, and for a 0.2% decrease in personal spending. And for the Core PCE price index to increase 0.2%. This release also includes Personal Income for January. The consensus is for a 0.4% increase in personal income.
• At 10:00 AM, ISM Manufacturing Index for February. The consensus is for the ISM to be at 55.0, down from 56.6 in January.
• At 10:00 AM, University of Michigan's Consumer sentiment index (Final for February). The consensus is for a reading of 95.5.
Fannie Mae: Mortgage Serious Delinquency Rate unchanged in January
by Calculated Risk on 2/28/2019 04:09:00 PM
Fannie Mae reported that the Single-Family Serious Delinquency rate was unchanged at 0.76% in January, from 0.76% in December. The serious delinquency rate is down from 1.23% in January 2018.
These are mortgage loans that are "three monthly payments or more past due or in foreclosure".
The Fannie Mae serious delinquency rate peaked in February 2010 at 5.59%.
This matches the last two months as the lowest serious delinquency rate for Fannie Mae since August 2007.

By vintage, for loans made in 2004 or earlier (3% of portfolio), 2.71% are seriously delinquent. For loans made in 2005 through 2008 (5% of portfolio), 4.58% are seriously delinquent, For recent loans, originated in 2009 through 2018 (92% of portfolio), only 0.33% are seriously delinquent. So Fannie is still working through poor performing loans from the bubble years.
The increase late last year in the delinquency rate was due to the hurricanes - there were no worries about the overall market.
I expect the serious delinquency rate will probably decline to 0.5 to 0.7 percent or so to a cycle bottom.
Note: Freddie Mac reported earlier.
Q4 GDP: Investment
by Calculated Risk on 2/28/2019 01:02:00 PM
The first graph below shows the contribution to GDP from residential investment, equipment and software, and nonresidential structures (3 quarter trailing average). This is important to follow because residential investment tends to lead the economy, equipment and software is generally coincident, and nonresidential structure investment trails the economy.
In the graph, red is residential, green is equipment and software, and blue is investment in non-residential structures. So the usual pattern - both into and out of recessions is - red, green, blue.
The dashed gray line is the contribution from the change in private inventories.

Residential investment (RI) decreased in Q4 (-3.5% annual rate in Q4). Equipment investment increased at a 6.7% annual rate, and investment in non-residential structures decreased at a 4.2% annual rate.
On a 3 quarter trailing average basis, RI (red) is down slightly, equipment (green) is positive, and nonresidential structures (blue) is up slightly.
Recently RI has been soft, but the decrease is fairly small.
I'll post more on the components of non-residential investment once the supplemental data is released.
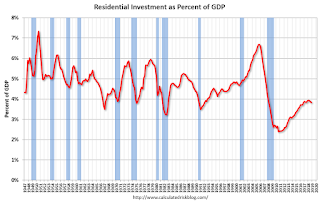
Residential Investment as a percent of GDP decreased in Q4, however RI has generally been increasing. RI as a percent of GDP is only just above the bottom of the previous recessions - and I expect RI to continue to increase further in this cycle.
The increase is now primarily coming from single family investment and home remodeling.
I'll break down Residential Investment into components after the GDP details are released.
Note: Residential investment (RI) includes new single family structures, multifamily structures, home improvement, broker's commissions, and a few minor categories.

Kansas City Fed: "Tenth District Manufacturing Activity Up Only Slightly"
by Calculated Risk on 2/28/2019 11:00:00 AM
From the Kansas City Fed: Tenth District Manufacturing Activity Up Only Slightly
The Federal Reserve Bank of Kansas City released the February Manufacturing Survey today. According to Chad Wilkerson, vice president and economist at the Federal Reserve Bank of Kansas City, the survey revealed that Tenth District manufacturing activity was up only slightly, while expectations for future activity remained positive but were slightly lower than in previous months.This was the last of the regional Fed surveys for February.
“Regional factories saw hardly any growth in February,” said Wilkerson. “More than three-quarters of firms reported difficulties in finding workers, despite wage increases.”
...
The month-over-month composite index was 1 in January, down from 5 in January and 6 in December. The composite index is an average of the production, new orders, employment, supplier delivery time, and raw materials inventory indexes. Factories expanded durable goods production, particularly machinery and transportation equipment, while manufacturing of more non-durable goods, including food and beverage products, declined. Most month-over-month indexes decreased in February, with production, shipments, and new orders dropping into negative territory. However, the month-over-month employment index expanded moderately.
emphasis added
Here is a graph comparing the regional Fed surveys and the ISM manufacturing index:
 Click on graph for larger image.
The New York and Philly Fed surveys are averaged together (yellow, through February), and five Fed surveys are averaged (blue, through February) including New York, Philly, Richmond, Dallas and Kansas City. The Institute for Supply Management (ISM) PMI (red) is through January (right axis).
Based on these regional surveys, it seems likely the ISM manufacturing index will be at about the same level in February as in January. The consensus forecast is for a reading of 55.0 (to be released on Friday, March 1st).
HVS: Q4 2018 Homeownership and Vacancy Rates
by Calculated Risk on 2/28/2019 10:09:00 AM
The Census Bureau released the Residential Vacancies and Homeownership report for Q4 2018.
This report is frequently mentioned by analysts and the media to track household formation, the homeownership rate, and the homeowner and rental vacancy rates. However, there are serious questions about the accuracy of this survey.
This survey might show the trend, but I wouldn't rely on the absolute numbers. The Census Bureau is investigating the differences between the HVS, ACS and decennial Census, and analysts probably shouldn't use the HVS to estimate the excess vacant supply or household formation, or rely on the homeownership rate, except as a guide to the trend.
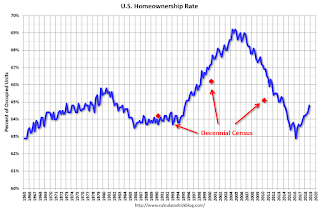
The Red dots are the decennial Census homeownership rates for April 1st 1990, 2000 and 2010. The HVS homeownership rate increased to 64.8% in Q4, from 64.4% in Q3.
I'd put more weight on the decennial Census numbers - given changing demographics, the homeownership rate has bottomed.

Once again - this probably shows the general trend, but I wouldn't rely on the absolute numbers.
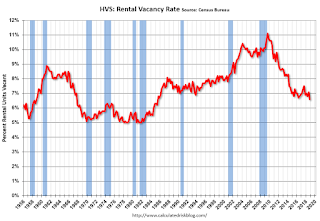
The quarterly HVS is the most timely survey on households, but there are many questions about the accuracy of this survey.
Overall this suggests that vacancies have declined significantly, and my guess is the homeownership rate has bottomed - and that the rental vacancy rate is close to the bottom for this cycle.


