by Calculated Risk on 3/12/2019 08:51:00 AM
Tuesday, March 12, 2019
BLS: CPI increase 0.2% in February, Core CPI increased 0.1%
The Consumer Price Index for All Urban Consumers (CPI-U) increased 0.2 percent in February on a seasonally adjusted basis after being unchanged in January, the U.S. Bureau of Labor Statistics reported today. Over the last 12 months, the all items index increased 1.5 percent before seasonal adjustment.I'll post a graph later today after the Cleveland Fed releases the median and trimmed-mean CPI.
...
The index for all items less food and energy increased 0.1 percent in February after rising 0.2 percent in January.
..
The all items index increased 1.5 percent for the 12 months ending February, a smaller increase than the 1.6-percent rise for the 12-months ending January. The index for all items less food and energy rose 2.1 percent over the last 12 months, a slightly smaller figure than the 2.2-percent increase for the period ending January.
emphasis added
Monday, March 11, 2019
Tuesday: CPI
by Calculated Risk on 3/11/2019 09:06:00 PM
From Matthew Graham at Mortgage News Daily: Mortgage Rates Start Week Near Long-Term Lows
Mortgage rates were roughly unchanged to begin the week. That means they are staying in line with the lowest levels in more than a year. Only 2 or 3 days have been any better, depending on the lender, and the differences are minimal. [30YR FIXED 4.375 - 4.5%]Tuesday:
emphasis added
• At 6:00 AM ET, NFIB Small Business Optimism Index for February.
• At 8:30 AM, The Consumer Price Index for February from the BLS. The consensus is for 0.2% increase in CPI, and a 0.2% increase in core CPI.
Seattle Real Estate in February: Sales Up 12.1% YoY, Inventory up 164% YoY from Low Levels
by Calculated Risk on 3/11/2019 05:37:00 PM
The Northwest Multiple Listing Service reported Heavy Snowfall Ices February Housing Activity Around Western Washington
Seattle's snowiest month in 50 years had an obvious chilling effect on February's housing activity, agreed officials with Northwest Multiple Listing Service. Statistics for last month show pending sales dropped nearly 14 percent compared to the same month a year ago.The press release is for the Northwest. In King County, sales were down 3.7% year-over-year, and active inventory was up 128% year-over-year.
"The winter weather brought the market to a halt," stated John Deely, principal managing broker at Coldwell Banker Bain. He said last month's series of snowstorms and frigid temperatures had a negative impact on the typical momentum that builds at the beginning of the year.
"Showing activity dropped more than 41 percent the week of the heaviest snow, and weekend keybox activity was down 80 percent," Deely reported. "The end of the month picked up as cabin fever weary buyers unleashed themselves on the burgeoning inventory," he added.
Despite the weather disruptions, brokers added 6,247 new listings to inventory during the month, 1,037 fewer than a year ago. At month end, Northwest MLS members reported 11,275 total active listings, a robust 42.3 percent jump from twelve months ago.
emphasis added
In Seattle, sales were up 12.1% year-over-year, and inventory was up 164% year-over-year from very low levels. This is another market with inventory increasing sharply year-over-year, but months-of-supply in Seattle is still on the low side at 2.0 months.
Mortgage Equity Withdrawal slightly positive in Q4
by Calculated Risk on 3/11/2019 11:31:00 AM
Note: This is not Mortgage Equity Withdrawal (MEW) data from the Fed. The last MEW data from Fed economist Dr. Kennedy was for Q4 2008.
The following data is calculated from the Fed's Flow of Funds data (released last week) and the BEA supplement data on single family structure investment. This is an aggregate number, and is a combination of homeowners extracting equity - hence the name "MEW" - and normal principal payments and debt cancellation (modifications, short sales, and foreclosures).
For Q4 2018, the Net Equity Extraction was a positive $1 billion, or a 0.0% of Disposable Personal Income (DPI) .

This graph shows the net equity extraction, or mortgage equity withdrawal (MEW), results, using the Flow of Funds (and BEA data) compared to the Kennedy-Greenspan method.
Note: This data is impacted by debt cancellation and foreclosures, but much less than a few years ago.
MEW has been positive for 9 of the last 11 quarters. With a slower rate of debt cancellation, MEW will likely be mostly positive going forward - but nothing like during the housing bubble.
The Fed's Flow of Funds report showed that the amount of mortgage debt outstanding increased by $56 billion in Q4.
The Flow of Funds report also showed that Mortgage debt has declined by $0.36 trillion since the peak.
For reference:
Dr. James Kennedy also has a simple method for calculating equity extraction: "A Simple Method for Estimating Gross Equity Extracted from Housing Wealth". Here is a companion spread sheet (the above uses my simple method).
For those interested in the last Kennedy data included in the graph, the spreadsheet from the Fed is available here.
BLS: Unemployment Rates Higher in 3 states in January; Lower in 3 States
by Calculated Risk on 3/11/2019 10:23:00 AM
From the BLS: Regional and State Employment and Unemployment Summary
Unemployment rates were lower in January in 3 states, higher in 3 states, and stable in 44 states and the District of Columbia, the U.S. Bureau of Labor Statistics reported today.
...
Iowa and New Hampshire had the lowest unemployment rates in January, 2.4 percent each. The rate in Vermont (2.5 percent) set a new series low. (All state series begin in 1976.) Alaska had the highest jobless rate, 6.5 percent.
emphasis added
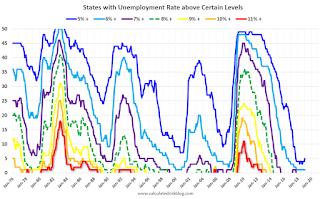
 Click on graph for larger image.
This graph shows the number of states (and D.C.) with unemployment rates at or above certain levels since January 1976.
At the worst of the great recession, there were 11 states with an unemployment rate at or above 11% (red).
Currently only one state, Alaska, has an unemployment rate at or above 6% (dark blue). Four states and the D.C. have unemployment rates above 5%; Alaska, Arizona, New Mexico and West Virginia.
A total of seven states are at the series low.
Retail Sales increased 0.2% in January
by Calculated Risk on 3/11/2019 08:45:00 AM
On a monthly basis, retail sales increased 0.2 percent from December to January (seasonally adjusted), and sales were up 2.3 percent from January 2018.
From the Census Bureau report:
Advance estimates of U.S. retail and food services sales for January 2019, adjusted for seasonal variation and holiday and trading-day differences, but not for price changes, were $504.4 billion, an increase of 0.2 percent from the previous month, and 2.3 percent above January 2018. … The November 2018 to December 2018 percent change was revised from down 1.2 percent to down 1.6 percent.
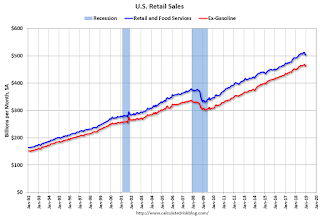
 Click on graph for larger image.
This graph shows retail sales since 1992. This is monthly retail sales and food service, seasonally adjusted (total and ex-gasoline).
Retail sales ex-gasoline were up 0.4% in January.
The second graph shows the year-over-year change in retail sales and food service (ex-gasoline) since 1993.
 Retail and Food service sales, ex-gasoline, increased by 3.1% on a YoY basis.
The increase in January was slightly above expectations, however sales in November and December were revised down significantly.
Sunday, March 10, 2019
Sunday Night Futures
by Calculated Risk on 3/10/2019 07:54:00 PM
Weekend:
• Schedule for Week of March 10, 2019
Monday:
• 8:30 AM: Retail sales for January is scheduled to be released. The consensus is for no change in retail sales.
• 10:00 AM: State Employment and Unemployment (Monthly) for January 2019
From CNBC: Pre-Market Data and Bloomberg futures: S&P 500 and DOW futures are mostly unchanged (fair value).
Oil prices were up slightly over the last week with WTI futures at $56.18 per barrel and Brent at $65.81 per barrel. A year ago, WTI was at $62, and Brent was at $65 - so WTI oil prices are down about 10% year-over-year, and Brent is unchanged.
Here is a graph from Gasbuddy.com for nationwide gasoline prices. Nationally prices are at $2.48 per gallon. A year ago prices were at $2.52 per gallon, so gasoline prices are down 4 cents per gallon year-over-year.
Public and Private Sector Payroll Jobs During Presidential Terms
by Calculated Risk on 3/10/2019 01:17:00 PM
By request, here is another update of tracking employment during Presidential terms. We frequently use Presidential terms as time markers - we could use Speaker of the House, Fed Chair, or any other marker.
NOTE: Several readers have asked if I could add a lag to these graphs (obviously a new President has zero impact on employment for the month they are elected). But that would open a debate on the proper length of the lag, so I'll just stick to the beginning of each term.
Important: There are many differences between these periods. Overall employment was smaller in the '80s, however the participation rate was increasing in the '80s (younger population and women joining the labor force), and the participation rate is generally declining now. But these graphs give an overview of employment changes.
The first graph shows the change in private sector payroll jobs from when each president took office until the end of their term(s). Presidents Carter and George H.W. Bush only served one term.
Mr. G.W. Bush (red) took office following the bursting of the stock market bubble, and left during the bursting of the housing bubble. Mr. Obama (dark blue) took office during the financial crisis and great recession. There was also a significant recession in the early '80s right after Mr. Reagan (dark red) took office.
There was a recession towards the end of President G.H.W. Bush (light purple) term, and Mr Clinton (light blue) served for eight years without a recession.

The first graph is for private employment only.
Mr. Trump is in Orange (25 months).
The employment recovery during Mr. G.W. Bush's (red) first term was sluggish, and private employment was down 821,000 jobs at the end of his first term. At the end of Mr. Bush's second term, private employment was collapsing, and there were net 382,000 private sector jobs lost during Mr. Bush's two terms.
Private sector employment increased by 20,979,000 under President Clinton (light blue), by 14,714,000 under President Reagan (dark red), 9,039,000 under President Carter (dashed green), 1,511,000 under President G.H.W. Bush (light purple), and 11,890,000 under President Obama (dark blue).
During the first 25 months of Mr. Trump's term, the economy has added 4,738,000 private sector jobs.

The public sector grew during Mr. Carter's term (up 1,304,000), during Mr. Reagan's terms (up 1,414,000), during Mr. G.H.W. Bush's term (up 1,127,000), during Mr. Clinton's terms (up 1,934,000), and during Mr. G.W. Bush's terms (up 1,744,000 jobs). However the public sector declined significantly while Mr. Obama was in office (down 269,000 jobs).
During the first 25 months of Mr. Trump's term, the economy has added 173,000 public sector jobs.

After 25 months of Mr. Trump's presidency, the economy has added 4,911,000 jobs, about 297,000 behind the projection.
Saturday, March 09, 2019
Schedule for Week of March 10, 2019
by Calculated Risk on 3/09/2019 08:11:00 AM
The key reports this week are January New Home Sales, February CPI and January retail sales.
For manufacturing, the February Industrial Production report and the March NY Fed manufacturing survey will be released.
 8:30 AM: Retail sales for January is scheduled to be released. The consensus is for no change in retail sales.
This graph shows the year-over-year change in retail sales and food service (ex-gasoline) since 1993. Retail and Food service sales, ex-gasoline, increased by 2.9% on a YoY basis in December.
10:00 AM: State Employment and Unemployment (Monthly) for January 2019
6:00 AM ET: NFIB Small Business Optimism Index for February.
8:30 AM: The Consumer Price Index for February from the BLS. The consensus is for 0.2% increase in CPI, and a 0.2% increase in core CPI.
7:00 AM ET: The Mortgage Bankers Association (MBA) will release the results for the mortgage purchase applications index.
8:30 AM: Durable Goods Orders for February from the Census Bureau. The consensus is for a 0.8% decrease in durable goods orders.
8:30 AM: The Producer Price Index for February from the BLS. The consensus is for a 0.2% increase in PPI, and a 0.2% increase in core PPI.
10:00 AM: Construction Spending for January. The consensus is for a 0.3% increase in construction spending.
8:30 AM: The initial weekly unemployment claims report will be released. The consensus is for 225 thousand initial claims, up from 223 thousand the previous week.
 10:00 AM: New Home Sales for January from the Census Bureau.
 This graph shows New Home Sales since 1963. The dashed line is the sales rate for last month.
The consensus is for 620 thousand SAAR, down from 621 thousand in December.
8:30 AM: The New York Fed Empire State manufacturing survey for March. The consensus is for a reading of 10.0, up from 8.8.
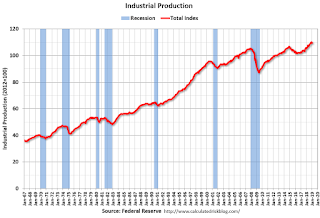
 9:15 AM: The Fed will release Industrial Production and Capacity Utilization for February.
This graph shows industrial production since 1967.
The consensus is for a 0.4% increase in Industrial Production, and for Capacity Utilization to increase to 78.5%.
10:00 AM: University of Michigan's Consumer sentiment index (Preliminary for March).
 10:00 AM ET: Job Openings and Labor Turnover Survey for January from the BLS.
 This graph shows job openings (yellow line), hires (purple), Layoff, Discharges and other (red column), and Quits (light blue column) from the JOLTS.
Jobs openings increased in December to 7.335 million from 7.166 million in November.
The number of job openings (yellow) were up 29% year-over-year, and Quits were up 4% year-over-year.
Friday, March 08, 2019
Fed Chair Powell: Monetary Policy: Normalization and the Road Ahead
by Calculated Risk on 3/08/2019 10:02:00 PM
From Fed Chair Jerome Powell: Monetary Policy: Normalization and the Road Ahead
The Committee has long said that the size of the balance sheet will be considered normalized when the balance sheet is once again at the smallest level consistent with conducting monetary policy efficiently and effectively. Just how large that will be is uncertain, because we do not yet have a clear sense of the normal level of demand for our liabilities. Current estimates suggest, however, that something in the ballpark of the 2019:Q4 projected values may be the new normal. The normalized balance sheet may be smaller or larger than that estimate and will grow gradually over time as demand for currency rises with the economy. In all plausible cases, the balance sheet will be considerably larger than before the crisis.
emphasis added


