by Calculated Risk on 4/01/2019 10:04:00 AM
Monday, April 01, 2019
ISM Manufacturing index Increased to 55.3 in March
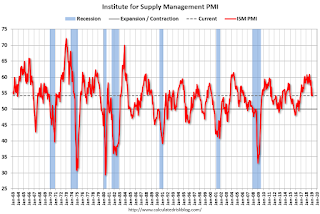
The ISM manufacturing index indicated expansion in March. The PMI was at 55.3% in March, up from 54.2% in February. The employment index was at 57.5%, up from 52.3% last month, and the new orders index was at 57.4%, up from 55.5%.
From the Institute for Supply Management: March 2019 Manufacturing ISM® Report On Business®
Economic activity in the manufacturing sector expanded in March, and the overall economy grew for the 119th consecutive month, say the nation’s supply executives in the latest Manufacturing ISM® Report On Business®.
The report was issued today by Timothy R. Fiore, CPSM, C.P.M., Chair of the Institute for Supply Management® (ISM®) Manufacturing Business Survey Committee: “The March PMI® registered 55.3 percent, an increase of 1.1 percentage points from the February reading of 54.2 percent. The New Orders Index registered 57.4 percent, an increase of 1.9 percentage points from the February reading of 55.5 percent. The Production Index registered 55.8 percent, a 1-percentage point increase compared to the February reading of 54.8 percent. The Employment Index registered 57.5 percent, an increase of 5.2 percentage points from the February reading of 52.3 percent. The Supplier Deliveries Index registered 54.2 percent, a 0.7 percentage point decrease from the February reading of 54.9 percent. The Inventories Index registered 51.8 percent, a decrease of 1.6 percentage points from the February reading of 53.4 percent. The Prices Index registered 54.3 percent, a 4.9-percentage point increase from the February reading of 49.4 percent, indicating a return of increasing raw materials prices after a two-month respite.
emphasis added
 Click on graph for larger image.
Here is a long term graph of the ISM manufacturing index.
This was above expectations of 54.0%, and suggests manufacturing expanded at a faster pace in March than in February.
Retail Sales decreased 0.2% in February
by Calculated Risk on 4/01/2019 08:47:00 AM
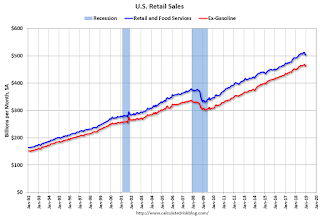
On a monthly basis, retail sales decreased 0.2 percent from January to February (seasonally adjusted), and sales were up 2.2 percent from February 2018.
From the Census Bureau report:
Advance estimates of U.S. retail and food services sales for February 2019, adjusted for seasonal variation and holiday and trading-day differences, but not for price changes, were $506.0 billion, a decrease of 0.2 percent from the previous month, but 2.2 percent above February 2018. … The December 2018 to January 2019 percent change was revised from up 0.2 percent to up 0.7 percent.
 Click on graph for larger image.
This graph shows retail sales since 1992. This is monthly retail sales and food service, seasonally adjusted (total and ex-gasoline).
Retail sales ex-gasoline were down 0.2% in February.
The second graph shows the year-over-year change in retail sales and food service (ex-gasoline) since 1993.
 Retail and Food service sales, ex-gasoline, increased by 3.2% on a YoY basis.
The increase in February was below expectations, however sales in January were revised up significantly.
Sunday, March 31, 2019
Monday: Retail Sales, ISM Mfg Survey, Construction Spending
by Calculated Risk on 3/31/2019 09:30:00 PM
Weekend:
• Schedule for Week of March 31, 2019
Monday:
• At 8:30 AM, Retail sales for February is scheduled to be released. The consensus is for a 0.3% increase in retail sales.
• Early, Reis Q1 2019 Office Survey of rents and vacancy rates.
• At 10:00 AM, ISM Manufacturing Index for March. The consensus is for the ISM to be at 54.0, down from 54.2 in February.
• At 10:00 AM, Construction Spending for February. The consensus is for a 0.1% decrease in construction spending.
From CNBC: Pre-Market Data and Bloomberg futures: S&P 500 are up 16 and DOW futures are up 150 (fair value).
Oil prices were up over the last week with WTI futures at $60.49 per barrel and Brent at $68.01 per barrel. A year ago, WTI was at $65, and Brent was at $69 - so oil prices are down slightly year-over-year.
Here is a graph from Gasbuddy.com for nationwide gasoline prices. Nationally prices are at $2.69 per gallon. A year ago prices were at $2.66 per gallon, so gasoline prices are up slightly year-over-year.
March 2019: Unofficial Problem Bank list declined to 72 Institutions, Q1 2019 Transition Matrix
by Calculated Risk on 3/31/2019 08:12:00 AM
Note: Surferdude808 compiles an unofficial list of Problem Banks compiled only from public sources.
Here is the unofficial problem bank list for March 2019.
Here are the monthly changes and a few comments from surferdude808:
Update on the Unofficial Problem Bank List for March 2019. During the month, the list dropped by four to 72 institutions after four removals. Assets decreased by $1.2 billion to $51.6 billion. A year ago, the list held 98 institutions with assets of $19.9 billion.
This month, actions have been terminated against Crown Bank, Elizabeth, NJ ($505 million); Connecticut Community Bank, National Association, Westport, CT ($461 million); WestSide Bank, Hiram, GA ($128 million); and Stonebridge Bank (n/k/a LINKBANK), West Chester, PA ($84 million).
With the conclusion of the first quarter, we bring an updated transition matrix to detail how banks are moving off the Unofficial Problem Bank List. Since the Unofficial Problem Bank List was first published on August 7, 2009 with 389 institutions, a total of 1,742 institutions have appeared on a weekly or monthly list since the start of publication. Only 4.1 percent of the banks that have appeared on a list remain today as 1,670 institutions have transitioned through the list. Departure methods include 983 action terminations, 406 failures, 262 mergers, and 19 voluntary liquidations. Of the 389 institutions on the first published list, only 6 or 1.5 percent, are still designated as being in a troubled status more than nine years later. The 406 failures represent 23.3 percent of the 1,742 institutions that have made an appearance on the list. This failure rate is well above the 10-12 percent rate frequently cited in media reports on the failure rate of banks on the FDIC's official list.
| Unofficial Problem Bank List | |||
|---|---|---|---|
| Change Summary | |||
| Number of Institutions | Assets ($Thousands) | ||
| Start (8/7/2009) | 389 | 276,313,429 | |
| Subtractions | |||
| Action Terminated | 179 | (68,279,301) | |
| Unassisted Merger | 41 | (10,072,112) | |
| Voluntary Liquidation | 5 | (10,672,586) | |
| Failures | 158 | (186,397,337) | |
| Asset Change | 251,957 | ||
| Still on List at 3/31/2019 | 6 | 1,144,050 | |
| Additions after 8/7/2009 | 66 | 50,478,968 | |
| End (3/31/2019) | 72 | 51,623,018 | |
| Intraperiod Removals1 | |||
| Action Terminated | 804 | 325,189,043 | |
| Unassisted Merger | 221 | 82,691,403 | |
| Voluntary Liquidation | 14 | 2,558,186 | |
| Failures | 248 | 125,152,210 | |
| Total | 1,287 | 535,590,842 | |
| 1Institution not on 8/7/2009 or 3/31/2019 list but appeared on a weekly list. | |||
Saturday, March 30, 2019
Schedule for Week of March 31, 2019
by Calculated Risk on 3/30/2019 08:11:00 AM
The key reports scheduled for this week are the March employment report, February Retail Sales, March Auto Sales, and the ISM Manufacturing survey.
Also, the Q1 quarterly Reis surveys for office and malls will be released this week.
 8:30 AM: Retail sales for February is scheduled to be released. The consensus is for a 0.3% increase in retail sales.
This graph shows the year-over-year change in retail sales and food service (ex-gasoline) since 1993. Retail and Food service sales, ex-gasoline, increased by 2.9% on a YoY basis in December.
Early: Reis Q1 2019 Office Survey of rents and vacancy rates.
 10:00 AM: ISM Manufacturing Index for March. The consensus is for the ISM to be at 54.0, down from 54.2 in February.
Here is a long term graph of the ISM manufacturing index.
The PMI was at 54.2% in February, the employment index was at 53.2%, and the new orders index was at 55.5%
10:00 AM: Construction Spending for February. The consensus is for a 0.1% decrease in construction spending.
 All day: Light vehicle sales for March. The consensus is for light vehicle sales to be 16.8 million SAAR in March, up from 16.5 million in February (Seasonally Adjusted Annual Rate).
This graph shows light vehicle sales since the BEA started keeping data in 1967. The dashed line is the February sales rate.
Early: Reis Q1 2019 Mall Survey of rents and vacancy rates.
8:30 AM: Durable Goods Orders for February from the Census Bureau. The consensus is for a 1.9% decrease in durable goods orders.
10:00 AM: Corelogic House Price index for February.
7:00 AM ET: The Mortgage Bankers Association (MBA) will release the results for the mortgage purchase applications index.
8:15 AM: The ADP Employment Report for March. This report is for private payrolls only (no government). The consensus is for 160,000 payroll jobs added in March, down from 183,000 added in February.
10:00 AM: the ISM non-Manufacturing Index for March. The consensus is for a reading of 58.0, down from 59.7.
8:30 AM: The initial weekly unemployment claims report will be released. The consensus is for 216 thousand initial claims, up from 211 thousand the previous week.
 8:30 AM: Employment Report for March. The consensus is for 169,000 jobs added, and for the unemployment rate to be unchanged at 3.8%.
There were 20,000 jobs added in February, and the unemployment rate was at 3.8%.
This graph shows the year-over-year change in total non-farm employment since 1968.
In February the year-over-year change was 2.509 million jobs.
3:00 PM: Consumer Credit from the Federal Reserve.
Friday, March 29, 2019
Reis: Apartment Vacancy Rate unchanged in Q1 at 4.8%
by Calculated Risk on 3/29/2019 04:27:00 PM
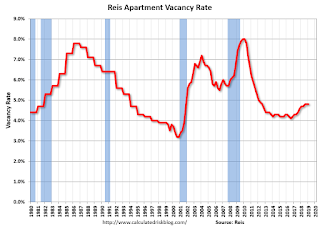
Reis reported that the apartment vacancy rate was at 4.8% in Q1 2019, unchanged from 4.8% in Q4, and up from 4.7% in Q1 2018. This ties the last two quarters as the highest vacancy rate since Q3 2012. The vacancy rate peaked at 8.0% at the end of 2009, and bottomed at 4.1% in 2016.
From economist Barbara Denham at Reis:
The apartment vacancy rate was flat in the quarter at 4.8%. In the first quarter of 2018 it was 4.7%, while at the start of 2017 it was 4.3%.
Both the national average asking rent and effective rent, which nets out landlord concessions, increased 0.5% in the first quarter. At $1,451 per unit (asking) and $1,380 per unit (effective), the average rents have increased 4.4% and 4.2%, respectively, from the first quarter of 2018.
...
Apartment occupancy growth had accelerated in 2018 after slowing a bit in 2017. At the same time, the housing market slumped in 2018 after gaining momentum in 2017. Recently, existing home sales jumped yet apartment occupancy growth was subdued. We had attributed the acceleration in the apartment market in 2018 to the tax cut at the end of 2017 that reduced the incentive to buy a home. Many have cited the drop in mortgage rates to the housing market jump in February.
A closer look at the numbers shows that the condo and coop sales were flat in the first two months of 2019 after falling in 2018. This is consistent with our apartment occupancy numbers and suggests that the housing market uptick was concentrated in less urban areas that do not compete as much with strong apartment construction. There are a number of factors impacting housing, but it is too early to say if the apartment market will suffer if the housing market has strengthened. The preliminary housing numbers from the National Association of Realtors are subject to change.
We still expect construction to remain robust in 2019 before completions decelerate in 2020. Occupancy should stay consistent with both supply growth and job growth, but the pent-up demand for buying a home could impact some markets more than others.
emphasis added
 Click on graph for larger image.
This graph shows the apartment vacancy rate starting in 1980. (Annual rate before 1999, quarterly starting in 1999). Note: Reis is just for large cities.
The vacancy rate had mostly moved sideways for the last several years and moved up a little more recently.
With more supply coming on line - and somewhat less favorable demographics - the vacancy rate will probably increase over the next year or so.
Apartment vacancy data courtesy of Reis.
Q1 GDP Forecasts: Mid 1% Range
by Calculated Risk on 3/29/2019 02:25:00 PM
From Merrill Lynch:
Consumer spending inched up only 0.1% mom in Jan, and a downwardly revised Dec provided a weaker handoff into the quarter. The data sliced 0.3pp from 1Q GDP tracking, bringing our estimate down to 1.7% qoq saar [March 29 estimate]From the NY Fed Nowcasting Report
emphasis added
The New York Fed Staff Nowcast stands at 1.3% for 2019:Q1 and 1.6% for 2019:Q2 [Mar 29 estimate].And from the Altanta Fed: GDPNow
The GDPNow model estimate for real GDP growth (seasonally adjusted annual rate) in the first quarter of 2019 is 1.7 percent on March 29, up from 1.5 percent on March 27. A decrease in the nowcast of first-quarter real personal consumption expenditures growth from 0.9 percent to 0.5 percent after this morning’s personal income and outlays release from the U.S. Bureau of Economic Analysis was more than offset by increases in the nowcasts of real nonresidential equipment investment growth, real residential investment growth, and the contribution of inventory investment to first-quarter real GDP growth. [Mar 13 estimate]CR Note: These estimates suggest real GDP growth will be in the 1% to 2% range annualized in Q1.
A few Comments on February New Home Sales
by Calculated Risk on 3/29/2019 12:10:00 PM
New home sales for February were reported at 667,000 on a seasonally adjusted annual rate basis (SAAR). This was well above the consensus forecast, and sales for January were revised up. However sales for November and December were revised down.
With these revisions, sales increased 1% in 2018 compared to 2017. I expect sales to be around the same level in 2019 as in 2018, and my guess is we haven't seen the peak of this cycle yet.
On Inventory: Months of inventory is now just above the top of the normal range, however the number of units completed and under construction is still somewhat low. Inventory will be something to watch very closely.
Earlier: New Home Sales increased to 667,000 Annual Rate in February.

This graph shows new home sales for 2018 and 2019 by month (Seasonally Adjusted Annual Rate).
Year-to-date (just through February), sales are up 2.8% compared to the same period in 2018. The comparison will be most difficult in Q1, so this is a solid start for 2019.
And here is another update to the "distressing gap" graph that I first started posting a number of years ago to show the emerging gap caused by distressed sales.
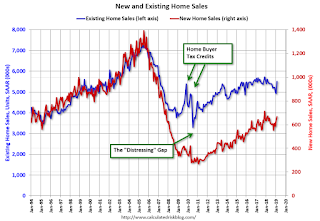 The "distressing gap" graph shows existing home sales (left axis) and new home sales (right axis) through February 2019. This graph starts in 1994, but the relationship had been fairly steady back to the '60s.
 Following the housing bubble and bust, the "distressing gap" appeared mostly because of distressed sales. The gap has persisted even though distressed sales are down significantly, since new home builders have focused on more expensive homes.
I still expect this gap to slowly close. However, this assumes that the builders will offer some smaller, less expensive homes. If not, then the gap will persist.
Existing home sales are counted when transactions are closed, and new home sales are counted when contracts are signed. So the timing of sales is different.
New Home Sales increased to 667,000 Annual Rate in February
by Calculated Risk on 3/29/2019 10:14:00 AM
The Census Bureau reports New Home Sales in February were at a seasonally adjusted annual rate (SAAR) of 667 thousand.
The previous month was revised up.
"Sales of new single‐family houses in February 2019 were at a seasonally adjusted annual rate of 667,000, according to estimates released jointly today by the U.S. Census Bureau and the Department of Housing and Urban Development. This is 4.9 percent above the revised January rate of 636,000 and is 0.6 percent above the February 2018 estimate of 663,000."
emphasis added
 Click on graph for larger image.
The first graph shows New Home Sales vs. recessions since 1963. The dashed line is the current sales rate.
Even with the increase in sales over the last several years, new home sales are still somewhat low historically.
The second graph shows New Home Months of Supply.
 The months of supply decreased in February to 6.1 months from 6.5 months in January.
 The all time record was 12.1 months of supply in January 2009.
This is above the normal range (less than 6 months supply is normal).
"The seasonally‐adjusted estimate of new houses for sale at the end of February was 340,000. This represents a supply of 6.1 months at the current sales rate."
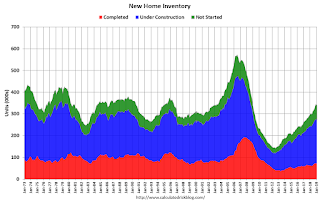 On inventory, according to the Census Bureau:
 "A house is considered for sale when a permit to build has been issued in permit-issuing places or work has begun on the footings or foundation in nonpermit areas and a sales contract has not been signed nor a deposit accepted."Starting in 1973 the Census Bureau broke this down into three categories: Not Started, Under Construction, and Completed.
The third graph shows the three categories of inventory starting in 1973.
The inventory of completed homes for sale is still somewhat low, and the combined total of completed and under construction is a little low.
 The last graph shows sales NSA (monthly sales, not seasonally adjusted annual rate).
In February 2019 (red column), 56 thousand new homes were sold (NSA). Last year, 54 thousand homes were sold in February.
The all time high for February was 109 thousand in 2005, and the all time low for February was 20 thousand in 2010.
This was well above expectations of 616 thousand sales SAAR, however, although sales in January were revised up, the two previous months (November and December) were revised down significantly. I'll have more later today.
Personal Income Increased 0.2% in February
by Calculated Risk on 3/29/2019 09:38:00 AM
The BEA released the Personal Income, February 2019; Personal Outlays, January 2019:
Due to the recent partial government shutdown, this report combines estimates for January and February 2019. January estimates include both personal income and outlays measures, while February estimates are limited to personal income. Estimates of outlays for February will be available with the next release on April 29, 2019.The increase in personal income for February was below expectations.
Personal income decreased $22.9 billion (-0.1 percent) in January according to estimates released today by the Bureau of Economic Analysis. Disposable personal income decreased $34.9 billion (-0.2 percent), and personal consumption expenditures increased $8.6 billion (0.1 percent).
Real DPI decreased 0.2 percent in January, and real PCE increased 0.1 percent. The PCE price index decreased 0.1 percent. Excluding food and energy, the PCE price index increased 0.1 percent.
...
Personal income increased $42.0 billion (0.2 percent) in February. Disposable personal income (DPI) increased $31.3 billion (0.2 percent)


