by Calculated Risk on 4/08/2019 06:40:00 PM
Monday, April 08, 2019
Tuesday: Job Openings
From Matthew Graham at Mortgage News Daily: Mortgage Rates Relatively Flat Today, But Tomorrow Brings Challenges
Mortgage rates were flat-to-slightly-higher today, depending on the lender and the time of day. … In the bigger picture, rates are on the edge of the lower range seen in recent weeks and the higher range that dominated most of 2019. [30YR FIXED - 4.125%]Tuesday:
emphasis added
• At 6:00 AM ET, NFIB Small Business Optimism Index for March.
• At 10:00 AM, Job Openings and Labor Turnover Survey for February from the BLS.
Update: Framing Lumber Prices Down 30% Year-over-year
by Calculated Risk on 4/08/2019 02:31:00 PM
Here is another monthly update on framing lumber prices. Lumber prices declined from the record highs in early 2018, and are now down about 30% year-over-year.
This graph shows two measures of lumber prices: 1) Framing Lumber from Random Lengths through April 5, 2019 (via NAHB), and 2) CME framing futures.

Right now Random Lengths prices are down 27% from a year ago, and CME futures are down 34% year-over-year.
There is a seasonal pattern for lumber prices, and usually prices will increase in the Spring, and peak around May, and then bottom around October or November - although there is quite a bit of seasonal variability.
AAR: March Rail Carloads down 8.9% YoY, Intermodal Down 1.5% YoY
by Calculated Risk on 4/08/2019 11:54:00 AM
From the Association of American Railroads (AAR) Rail Time Indicators. Graphs and excerpts reprinted with permission.
We used this phrase a few years ago in Rail Time Indicators, but it’s appropriate again now: sometimes you’re the windshield and sometimes you’re the bug. In March, railroads were the bug. Total U.S. rail carloads in March 2019 were down 8.9% (93,616 carloads) from March 2018. That’s the biggest percentage decline for total carloads for any month since May 2016. … U.S. intermodal originations were down 1.5% (16,387 containers and trailers) in March 2019 from March 2018. Combined with a 0.9% decline in February, this marks the first two-month decline for intermodal since October 2016.
A slowing economy may be having an impact on rail traffic, but bad weather is a more likely culprit. March had bad weather events in many places, but the worst was the horrendous flooding in Nebraska and Iowa caused by melting snow and heavy rain.
emphasis added
 Click on graph for larger image.
This graph from the Rail Time Indicators report shows U.S. average weekly rail carloads (NSA). Red is 2019.
Rail carloads have been weak over the last decade due to the decline in coal shipments.
In March, just 4 of the 20 carload commodity categories the AAR tracks saw carload gains — the fewest since July 2016. The 8.9% decline in March was the biggest percentage decline for total carloads for any month since May 2016, and follows a 2.7% decline in February. Weekly average total carloads in March 2019 were 239,286, the fourth lowest of any month since sometime prior to 1988, when our data begin.
For the first quarter of 2019, total carloads were down 3.1%, or 100,800 carloads, from the first quarter of 2018. That’s the biggest quarterly decline since the third quarter of 2016.
 The second graph is for intermodal traffic (using intermodal or shipping containers):
U.S. intermodal originations were down 1.5% (16,387 containers and trailers) in March 2019 from March 2018. Combined with a 0.9% decline in February, this marks the first two-month decline since October 2016. Weekly average intermodal volume in March 2019 was 266,448 units, the second best for March in history (behind March 2018). For the first quarter, intermodal was down 0.6%.Traffic will likely pick up in April, and there might be some bounce back from the poor weather and flooding.
Las Vegas Real Estate in March: Sales Down 16% YoY, Inventory up 92% YoY
by Calculated Risk on 4/08/2019 09:36:00 AM
This is a key former distressed market to follow since Las Vegas saw the largest price decline, following the housing bubble, of any of the Case-Shiller composite 20 cities.
The Greater Las Vegas Association of Realtors reported Local home prices inch up to $300,000 as homes selling at slower pace; GLVAR housing statistics for March 2019
Local home prices inched back up to the $300,000 mark in March while fewer properties changed hands and more homes were on the market than one year ago. So says a report released Monday by the Greater Las Vegas Association of REALTORS® (GLVAR).1) Overall sales were down 16% year-over-year from 3,886 in March 2018 to 3,260 in March 2019.
...
The total number of existing local homes, condos and townhomes sold during March was 3,260. Compared to one year ago, March sales were down 16.8 percent for homes and down 12.9 percent for condos and townhomes.
...
At the current sales pace, Carpenter said Southern Nevada now has less than a three-month supply of homes available for sale. That’s up sharply from one year ago, but still below what would normally be considered a balanced market. By the end of March, GLVAR reported 7,091 single-family homes listed for sale without any sort of offer. That’s up 84.9 percent from one year ago. For condos and townhomes, the 1,751 properties listed without offers in March represented a 130.1 percent jump from one year ago.
...
The number of so-called distressed sales also continues to drop. GLVAR reported that short sales and foreclosures combined accounted for just 2.5 percent of all existing local property sales in March. That’s down from 2.9 percent of all sales one year ago and from 9.8 percent two years ago.
emphasis added
2) Active inventory (single-family and condos) is up sharply from a year ago, from a total of 4,596 in March 2018 to 8,842 in March 2019. Note: Total inventory was up 92% year-over-year. This is a significant increase in inventory, although smaller than the previous two months, and months-of-supply is still somewhat low.
3) Fewer distressed sales.
Sunday, April 07, 2019
Sunday Night Futures
by Calculated Risk on 4/07/2019 08:14:00 PM
Weekend:
• Schedule for Week of April 7, 2019
Monday:
• No major economic releases scheduled.
From CNBC: Pre-Market Data and Bloomberg futures: S&P 500 are unchanged and DOW futures are up 40 (fair value).
Oil prices were up over the last week with WTI futures at $63.08 per barrel and Brent at $70.34 per barrel. A year ago, WTI was at $63, and Brent was at $68 - so oil prices are mostly unchanged year-over-year.
Here is a graph from Gasbuddy.com for nationwide gasoline prices. Nationally prices are at $2.74 per gallon. A year ago prices were at $2.65 per gallon, so gasoline prices are up 9 cents per gallon year-over-year.
Oil: "A big jump" in Rig Counts
by Calculated Risk on 4/07/2019 11:13:00 AM
A few comments from Steven Kopits of Princeton Energy Advisors LLC on April 5, 2019:
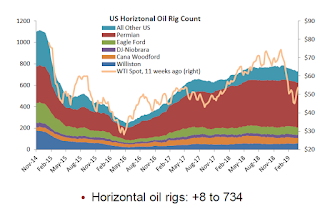
• Oil rigs rebounded sharply, +15 to 831
• Horizontal oil rig counts also saw a nice move up, +8 to 734
• The Permian took all the net horizontal oil rig adds, +8, for the best week in a year
• One might be tempted to call the end of the mini-cycle – again – this week. It certainly could be.
 Click on graph for larger image.
CR note: This graph shows the US horizontal rig count by basin.
Graph and comments Courtesy of Steven Kopits of Princeton Energy Advisors LLC.
Saturday, April 06, 2019
Schedule for Week of April 7, 2019
by Calculated Risk on 4/06/2019 08:11:00 AM
The key report this week is the March CPI.
No major economic releases scheduled.
6:00 AM ET: NFIB Small Business Optimism Index for March.
 10:00 AM ET: Job Openings and Labor Turnover Survey for February from the BLS.
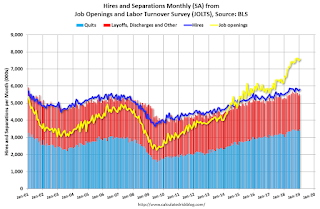
 This graph shows job openings (yellow line), hires (purple), Layoff, Discharges and other (red column), and Quits (light blue column) from the JOLTS.
Jobs openings increased in January to 7.581 million from 7.479 million in December.
The number of job openings (yellow) were up 15% year-over-year, and Quits were also up 15% year-over-year.
7:00 AM ET: The Mortgage Bankers Association (MBA) will release the results for the mortgage purchase applications index.
8:30 AM: The Consumer Price Index for March from the BLS. The consensus is for 0.3% increase in CPI, and a 0.2% increase in core CPI.
2:00 PM: FOMC Minutes, Meeting of March 19-20, 2019
8:30 AM: The initial weekly unemployment claims report will be released. The consensus is for 211 thousand initial claims, up from 202 thousand the previous week.
8:30 AM: The Producer Price Index for March from the BLS. The consensus is for a 0.3% increase in PPI, and a 0.2% increase in core PPI.
10:00 AM: University of Michigan's Consumer sentiment index (Preliminary for April).
Friday, April 05, 2019
BEA: March Vehicles Sales at 17.5 Million SAAR
by Calculated Risk on 4/05/2019 07:55:00 PM
The BEA released their estimate of March vehicle sales. The BEA estimated sales of 17.48 million SAAR in March 2019 (Seasonally Adjusted Annual Rate), up 5.7% from the February sales rate, and up 1.4% from March 2018.
With the strong sales in March, 2019 is averaging 16.9 million (average of seasonally adjusted rate), just behind sales last year (17.0 million average through Q1).
Click on graph for larger image.
This graph shows annual light vehicle sales since 1976. Source: BEA.
Sales for 2018 were the fourth best ever, and the 2019 sales rate is lower than in 2018.
The second graph shows light vehicle sales since the BEA started keeping data in 1967.

A small decline in sales this year isn't a concern - I think sales will move mostly sideways at near record levels.
This means the economic boost from increasing auto sales is over (from the bottom in 2009, auto sales boosted growth every year through 2016).
Public and Private Sector Payroll Jobs During Presidential Terms
by Calculated Risk on 4/05/2019 04:39:00 PM
By request, here is another update of tracking employment during Presidential terms. We frequently use Presidential terms as time markers - we could use Speaker of the House, Fed Chair, or any other marker.
NOTE: Several readers have asked if I could add a lag to these graphs (obviously a new President has zero impact on employment for the month they are elected). But that would open a debate on the proper length of the lag, so I'll just stick to the beginning of each term.
Important: There are many differences between these periods. Overall employment was smaller in the '80s, however the participation rate was increasing in the '80s (younger population and women joining the labor force), and the participation rate is generally declining now. But these graphs give an overview of employment changes.
The first graph shows the change in private sector payroll jobs from when each president took office until the end of their term(s). Presidents Carter and George H.W. Bush only served one term.
Mr. G.W. Bush (red) took office following the bursting of the stock market bubble, and left during the bursting of the housing bubble. Mr. Obama (dark blue) took office during the financial crisis and great recession. There was also a significant recession in the early '80s right after Mr. Reagan (dark red) took office.
There was a recession towards the end of President G.H.W. Bush (light purple) term, and Mr Clinton (light blue) served for eight years without a recession.

The first graph is for private employment only.
Mr. Trump is in Orange (26 months).
The employment recovery during Mr. G.W. Bush's (red) first term was sluggish, and private employment was down 821,000 jobs at the end of his first term. At the end of Mr. Bush's second term, private employment was collapsing, and there were net 382,000 private sector jobs lost during Mr. Bush's two terms.
Private sector employment increased by 20,979,000 under President Clinton (light blue), by 14,714,000 under President Reagan (dark red), 9,039,000 under President Carter (dashed green), 1,511,000 under President G.H.W. Bush (light purple), and 11,890,000 under President Obama (dark blue).
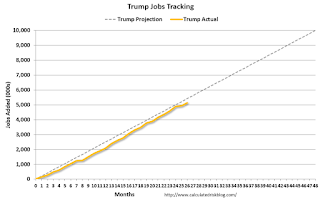
During the first 26 months of Mr. Trump's term, the economy has added 4,912,000 private sector jobs.

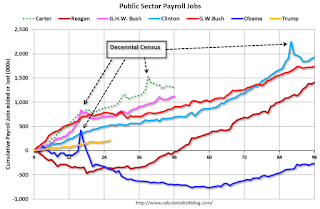
The public sector grew during Mr. Carter's term (up 1,304,000), during Mr. Reagan's terms (up 1,414,000), during Mr. G.H.W. Bush's term (up 1,127,000), during Mr. Clinton's terms (up 1,934,000), and during Mr. G.W. Bush's terms (up 1,744,000 jobs). However the public sector declined significantly while Mr. Obama was in office (down 269,000 jobs).
During the first 26 months of Mr. Trump's term, the economy has added 209,000 public sector jobs.

After 26 months of Mr. Trump's presidency, the economy has added 5,121,000 jobs, about 296,000 behind the projection.
Q1 GDP Forecasts: 1.5% to 2.0% Range
by Calculated Risk on 4/05/2019 12:22:00 PM
From Merrill Lynch:
We are tracking 1.9% qoq saar for 1Q GDP growth. Retail sales and capex data this week had little impact on tracking, while strong construction and inventory reports mostly offset consumption weakness at the end of the prior week. [April 5 estimate]From Goldman Sachs:
emphasis added
Our Q1 GDP tracking estimate rose by one tenth to +1.5% (qoq ar). [April 5 estimate]From the NY Fed Nowcasting Report
The New York Fed Staff Nowcast stands at 1.4% for 2019:Q1 and 1.9% for 2019:Q2 [Apr 5 estimate].And from the Altanta Fed: GDPNow
The GDPNow model estimate for real GDP growth (seasonally adjusted annual rate) in the first quarter of 2019 is 2.1 percent on April 2 [Apr 2 estimate]CR Note: These estimates suggest real GDP growth will be in the 1.5% to 2.0% range annualized in Q1.


