by Calculated Risk on 4/18/2019 01:11:00 PM
Thursday, April 18, 2019
NMHC: Apartment Market Tightness Index Increased in April
The National Multifamily Housing Council (NMHC) released their April report: April NMHC Quarterly Survey Highlights Continued Strength of the Apartment Market
he apartment market showed signs of strengthening in the National Multifamily Housing Council’s Quarterly Survey of Apartment Market Conditions for April 2019. The Market Tightness (52), Equity Financing (53), and Debt Financing (81) indexes were all above the breakeven level (50), while the Sales Volume index (45) improved, but still showed some continued softness on property sales.This index helped me call the bottom for effective rents (and the top for the vacancy rate) early in 2010. And it also helped me call the bottom in vacancy rate more recently.
“Even as overall economic growth slowed somewhat in the last quarter of 2018 and the first quarter of 2019, the apartment market has rallied,” noted NMHC Chief Economist Mark Obrinsky. “Thirty percent of respondents saw stronger rents and occupancy levels, the most since July 2015. Strong demand for apartments across the country continues to underpin the apartment industry’s strong fundamentals.”
…
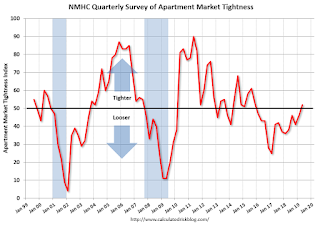
The Market Tightness Index increased from 46 to 52, indicating overall improving conditions for the first time since October of 2015. Nearly one-third (30 percent) of respondents reported tighter market conditions in the three months prior compared to 25 percent who reported looser conditions. Almost half (45 percent) of respondents felt that conditions were no different from last quarter.

Click on graph for larger image.
This graph shows the quarterly Apartment Tightness Index. Any reading above 50 indicates tighter conditions from the previous quarter. This indicates market conditions were tighter over the last quarter.
This reading followed thirteen consecutive quarterly surveys indicating looser conditions.
Philly Fed Mfg "Continued to Grow" in April
by Calculated Risk on 4/18/2019 10:28:00 AM
From the Philly Fed: April 2019 Manufacturing Business Outlook Survey
Regional manufacturing activity continued to grow in April, according to results from this month’s Manufacturing Business Outlook Survey. Although the survey’s indicators for general activity and shipments fell from their readings last month, the indicators for new orders, employment, and the workweek improved. The survey’s indexes for future activity and employment continued to moderate, but the surveyed firms remained generally optimistic about growth over the next six months.Here is a graph comparing the regional Fed surveys and the ISM manufacturing index:
The index for current manufacturing activity in the region decreased from a reading of 13.7 in March to 8.5 this month.
...
The firms continued to add to their payrolls this month. The current employment index increased from a reading of 9.6 in March to 14.7 this month.
emphasis added
 Click on graph for larger image.
The New York and Philly Fed surveys are averaged together (yellow, through April), and five Fed surveys are averaged (blue, through March) including New York, Philly, Richmond, Dallas and Kansas City. The Institute for Supply Management (ISM) PMI (red) is through March (right axis).
These early reports suggest the ISM manufacturing index will show expansion again in April, and probably at about the same pace as in March.
Retail Sales increased 1.6% in March
by Calculated Risk on 4/18/2019 08:48:00 AM
On a monthly basis, retail sales decreased 0.2 percent from February to March (seasonally adjusted), and sales were up 3.6 percent from March 2018.
From the Census Bureau report:
Advance estimates of U.S. retail and food services sales for March 2019, adjusted for seasonal variation and holiday and trading-day differences, but not for price changes, were $514.1 billion, an increase of 1.6 percent from the previous month, and 3.6 percent above March 2018. … The January 2019 to February 2019 percent change was unrevised from down 0.2 percent.
 Click on graph for larger image.
This graph shows retail sales since 1992. This is monthly retail sales and food service, seasonally adjusted (total and ex-gasoline).
Retail sales ex-gasoline were up 1.4% in March.
The second graph shows the year-over-year change in retail sales and food service (ex-gasoline) since 1993.
 Retail and Food service sales, ex-gasoline, increased by 3.65% on a YoY basis.
The increase in March was well above expectations, and sales in January and February were revised up, combined. A solid report following the recent weakness in retail sales.
Weekly Initial Unemployment Claims decreased to 192,000
by Calculated Risk on 4/18/2019 08:37:00 AM
The DOL reported:
In the week ending April 13, the advance figure for seasonally adjusted initial claims was 192,000, a decrease of 5,000 from the previous week's revised level. This is the lowest level for initial claims since September 6, 1969 when it was 182,000. The previous week's level was revised up by 1,000 from 196,000 to 197,000. The 4-week moving average was 201,250, a decrease of 6,000 from the previous week's revised average. This is the lowest level for this average since November 1, 1969 when it was 200,500. The previous week's average was revised up by 250 from 207,000 to 207,250The previous week was revised up.
emphasis added
The following graph shows the 4-week moving average of weekly claims since 1971.
 Click on graph for larger image.
The dashed line on the graph is the current 4-week average. The four-week average of weekly unemployment claims decreased to 201,250.
This was below the consensus forecast.
Wednesday, April 17, 2019
Thursday: Retail Sales, Unemployment Claims, Philly Fed Mfg
by Calculated Risk on 4/17/2019 09:06:00 PM
Thursday:
• At 8:30 AM: The initial weekly unemployment claims report will be released. The consensus is for 206 thousand initial claims, up from 196 thousand the previous week.
• At 8:30 AM: Retail sales for March is scheduled to be released. The consensus is for 0.8% increase in retail sales.
• At 8:30 AM: the Philly Fed manufacturing survey for April. The consensus is for a reading of 10.2, down from 13.7.
Lawler: Early Read on Existing Home Sales in March
by Calculated Risk on 4/17/2019 03:30:00 PM
From housing economist Tom Lawler: Early Read on Existing Home Sales in March
Based on publicly-available local realtor/MLS reports released across the country through today, I project that existing home sales as estimated by the National Association of Realtors ran at a seasonally adjusted annual rate of 5.40 million in March, down 2.0% from February’s preliminary pace and down 2.0% from last March’s seasonally adjusted pace. Unadjusted sales should show a larger YOY decline, reflecting this March’s lower business day count relative to last March.
On the inventory front, local realtor/MLS data, as well as data from other inventory trackers, suggest that the inventory of existing homes for sale at the end of March should be about 4.3% higher than last March.
Finally, local realtor/MLS data suggest that the median US existing single-family home sales price last month was up by about 3.5% from a year earlier.
CR Note: Existing home sales for March are scheduled to be released on Monday, April 22nd.
Fed's Beige Book: Economic Growth "Slight to moderate", Labor Market "Tight"
by Calculated Risk on 4/17/2019 03:26:00 PM
Fed's Beige Book "This report was prepared at the Federal Reserve Bank of St. Louis based on information collected on or before April 8, 2019."
Economic activity expanded at a slight-to-moderate pace in March and early April. While most Districts reported that growth continued at a similar pace as the previous report, a few Districts reported some strengthening. There was little change in the outlook among contacts in reporting Districts, with those expecting slight-to-modest growth in the months ahead. Reports on consumer spending were mixed but suggested sluggish sales for both general retailers and auto dealers. Reports on tourism were generally more upbeat. Reports on loan demand were mixed, but indicated steady growth. Reports on manufacturing activity were favorable, although contacts in many Districts noted trade-related uncertainty. Most Districts reported stronger home sales, although some Districts noted low demand for higher-priced homes. Among reporting Districts, agricultural conditions remained weak, with contacts expressing concerns over the impact of current and future rainfall and flooding.
...
Employment continued to increase nationwide, with nine Districts reporting modest or moderate growth and the other three reporting slight growth. While contacts reported gains across a variety of industries, employment increases were most highly concentrated in high-skilled jobs. However, labor markets remained tight, restraining the rate of growth. A majority of Districts cited shortages of skilled laborers, most commonly in manufacturing and construction.
emphasis added
AIA: "Architecture Billings Index backslides in March"
by Calculated Risk on 4/17/2019 10:26:00 AM
Note: This index is a leading indicator primarily for new Commercial Real Estate (CRE) investment.
From the AIA: Architecture Billings Index backslides in March
Following consistently increasing demand for design services for over two years, the Architecture Billings Index (ABI) dipped into negative territory in March, according to a new report today from The American Institute of Architects (AIA).
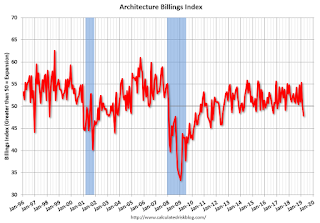
The ABI score for March was 47.8, down from 50.3 in February. Indicators of work in the pipeline, including inquiries into new projects and the value of new design contracts remained positive.
“Though billings haven’t contracted in a while, it is important to note that it does follow on the heels of a particularly tough late winter period for much of the country,” said AIA Chief Economist Kermit Baker, PhD, Hon. AIA. “Many indicators of future work at firms still remain positive, although the pace of growth of design contracts has slowed in recent months.“
...
• Regional averages: South (54.2), Midwest (48.7), West (47.2), Northeast (43.5)
• Sector index breakdown: mixed practice (53.1), commercial/industrial (47.0), institutional (48.9), multi-family residential (47.7)
emphasis added
 Click on graph for larger image.
This graph shows the Architecture Billings Index since 1996. The index was at 47.8 in March, down from 50.3 in February. Anything below 50 indicates contraction in demand for architects' services.
Note: This includes commercial and industrial facilities like hotels and office buildings, multi-family residential, as well as schools, hospitals and other institutions.
According to the AIA, there is an "approximate nine to twelve month lag time between architecture billings and construction spending" on non-residential construction. This index has been positive for 11 of the previous 12 months, suggesting a further increase in CRE investment in 2019.
Trade Deficit Decreased to $49.4 Billion in February
by Calculated Risk on 4/17/2019 08:41:00 AM
From the Department of Commerce reported:
The U.S. Census Bureau and the U.S. Bureau of Economic Analysis announced today that the goods and services deficit was $49.4 billion in February, down $1.8 billion from $51.1 billion in January, revised.
February exports were $209.7 billion, $2.3 billion more than January exports. February imports were $259.1 billion, $0.6 billion more than January imports.
 Click on graph for larger image.
Exports increased and imports decreased in January.
Exports are 27% above the pre-recession peak and up 2% compared to February 2018; imports are 12% above the pre-recession peak, and down slightly compared to February 2018.
In general, trade has been picking up, although both imports and exports have declined slightly recently.
The second graph shows the U.S. trade deficit, with and without petroleum.
 The blue line is the total deficit, and the black line is the petroleum deficit, and the red line is the trade deficit ex-petroleum products.
Oil imports averaged $46.89 per barrel in February, up from $42.59 in January, and down from $54.61 in February 2018.
The trade deficit with China decreased to $24.8 billion in February, from $29.3 billion in February 2018.
MBA: Mortgage Applications Decreased in Latest Weekly Survey
by Calculated Risk on 4/17/2019 07:00:00 AM
From the MBA: Mortgage Applications Decrease in Latest MBA Weekly Survey
Mortgage applications decreased 3.5 percent from one week earlier, according to data from the Mortgage Bankers Association’s (MBA) Weekly Mortgage Applications Survey for the week ending April 12, 2019.
... The Refinance Index decreased 8 percent from the previous week. The seasonally adjusted Purchase Index increased 1 percent from one week earlier. The unadjusted Purchase Index increased 2 percent compared with the previous week and was 7 percent higher than the same week one year ago.
...
“Mortgage applications decreased over the week, driven by a decline in refinances. With mortgage rates up for the second week in a row, it’s no surprise that refinancings slid 8 percent and average loan sizes dropped back closer to normal levels,” said Joel Kan, MBA’s Associate Vice President of Economic and Industry Forecasting. “Purchase activity remained strong and increased slightly, reaching its highest level since April 2010. The spring buying season continues to be robust, with activity more than 7 percent higher than a year ago and up year-over-year for the ninth straight week.”
...
The average contract interest rate for 30-year fixed-rate mortgages with conforming loan balances ($484,350 or less) increased to 4.44 percent from 4.40 percent, with points decreasing to 0.42 from 0.47 (including the origination fee) for 80 percent loan-to-value ratio (LTV) loans.
emphasis added
 Click on graph for larger image.
The first graph shows the refinance index since 1990.
Once mortgage rates fell more than 50 bps from the highs of last year, a number of recent buyers were able to refinance. But it would take another significant decrease in rates to see further refinance activity.
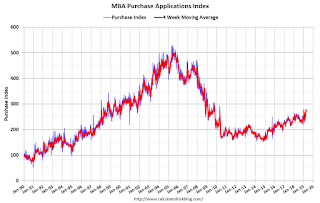
 The second graph shows the MBA mortgage purchase index
According to the MBA, purchase activity is up 7% year-over-year.


