by Calculated Risk on 5/01/2019 11:14:00 AM
Wednesday, May 01, 2019
Construction Spending decreased 0.9% in March
From the Census Bureau reported that overall construction spending decreased in March:
Construction spending during March 2019 was estimated at a seasonally adjusted annual rate of $1,282.2 billion, 0.9 percent below the revised February estimate of $1,293.3 billion. The March figure is 0.8 percent below the March 2018 estimate of $1,293.1 billion.Both private and public spending decreased:
Spending on private construction was at a seasonally adjusted annual rate of $961.5 billion, 0.7 percent below the revised February estimate of $968.6 billion. ...
In March, the estimated seasonally adjusted annual rate of public construction spending was $320.7 billion, 1.3 percent below the revised February estimate of $324.7 billion.
emphasis added
 Click on graph for larger image.
This graph shows private residential and nonresidential construction spending, and public spending, since 1993. Note: nominal dollars, not inflation adjusted.
Private residential spending had been increasing - but turned down in the 2nd half of 2018 - and is now 26% below the bubble peak.
Non-residential spending is 11% above the previous peak in January 2008 (nominal dollars).
Public construction spending is just below the previous peak in March 2009, and 23% above the austerity low in February 2014.
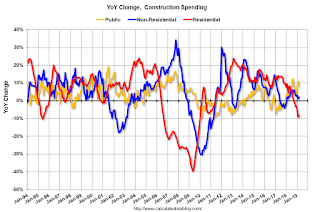 The second graph shows the year-over-year change in construction spending.
On a year-over-year basis, private residential construction spending is down 8%. Non-residential spending is up 2% year-over-year. Public spending is up 1% year-over-year.
This was well below consensus expectations, and spending for January and February were revised down significantly. A weak report.
ISM Manufacturing index Decreased to 52.8 in April
by Calculated Risk on 5/01/2019 10:05:00 AM
The ISM manufacturing index indicated expansion in April. The PMI was at 52.8% in April, down from 55.3% in March. The employment index was at 52.4%, down from 57.5% last month, and the new orders index was at 51.7%, down from 57.4%.
From the Institute for Supply Management: April 2019 Manufacturing ISM® Report On Business®
Economic activity in the manufacturing sector expanded in April, and the overall economy grew for the 120th consecutive month, say the nation—s supply executives in the latest Manufacturing ISM® Report On Business®.
The report was issued today by Timothy R. Fiore, CPSM, C.P.M., Chair of the Institute for Supply Management® (ISM®) Manufacturing Business Survey Committee: "The April PMI® registered 52.8 percent, a decrease of 2.5 percentage points from the March reading of 55.3 percent. The New Orders Index registered 51.7 percent, a decrease of 5.7 percentage points from the March reading of 57.4 percent. The Production Index registered 52.3 percent, a 3.5-percentage point decrease compared to the March reading of 55.8 percent. The Employment Index registered 52.4 percent, a decrease of 5.1 percentage points from the March reading of 57.5 percent. The Supplier Deliveries Index registered 54.6 percent, a 0.4-percentage point increase from the March reading of 54.2 percent. The Inventories Index registered 52.9 percent, an increase of 1.1 percentage points from the March reading of 51.8 percent. The Prices Index registered 50 percent, a 4.3-percentage point decrease from the March reading of 54.3 percent.
emphasis added
 Click on graph for larger image.
Here is a long term graph of the ISM manufacturing index.
This was below expectations of 55.0%, and suggests manufacturing expanded at a slower pace in April than in March.
ADP: Private Employment increased 275,000 in April
by Calculated Risk on 5/01/2019 08:18:00 AM
Private sector employment increased by 275,000 jobs from March to April according to the April ADP National Employment Report®. ... The report, which is derived from ADP’s actual payroll data, measures the change in total nonfarm private employment each month on a seasonally-adjusted basis.This was well above the consensus forecast for 180,000 private sector jobs added in the ADP report.
...
“April posted an uptick in growth after the first quarter appeared to signal a moderation following a strong 2018,” said Ahu Yildirmaz, vice president and co-head of the ADP Research Institute. “The bulk of the overall growth is with service providers, adding the strongest gain in more than two years.”
Mark Zandi, chief economist of Moody’s Analytics, said, “The job market is holding firm, as businesses work hard to fill open positions. The economic soft patch at the start of the year has not materially impacted hiring. April’s job gains overstate the economy’s strength, but they make the case that expansion continues on.”
The BLS report will be released Friday, and the consensus is for 180,000 non-farm payroll jobs added in April.
MBA: Mortgage Applications Decreased in Latest Weekly Survey
by Calculated Risk on 5/01/2019 07:00:00 AM
From the MBA: Mortgage Applications Decrease in Latest MBA Weekly Survey
Mortgage applications decreased 4.3 percent from one week earlier, according to data from the Mortgage Bankers Association’s (MBA) Weekly Mortgage Applications Survey for the week ending April 26, 2019.
... The Refinance Index decreased 5 percent from the previous week. The seasonally adjusted Purchase Index decreased 4 percent from one week earlier. The unadjusted Purchase Index decreased 3 percent compared with the previous week and was 1 percent higher than the same week one year ago.
...
“Mortgage rates were lower last week – with the 30-year fixed rate declining to 4.42 percent – as concerns over global growth, particularly in Germany, outweighed more positive domestic news on first quarter GDP growth and business investment,” said Joel Kan, MBA’s Associate Vice President of Economic and Industry Forecasting. “Applications to refinance and purchase a home both fell, but purchase activity still remained slightly above year ago levels. The drop in refinances were driven by fewer FHA and VA loan applications, which typically lag the movement of conventional loans.”
Added Kan, “The ARM share of applications decreased to 6.2 percent, its lowest share since August 2018. So far in 2019, we continue to see a preference for 7/1 ARMs, which account for around 36 percent of all ARM applications, followed by 10/1 and 5/1 ARMs. This is another indication that the few borrowers who choose to apply for ARM loans are electing to reap the benefit of lower rates, as well as some rate stability.”
...
The average contract interest rate for 30-year fixed-rate mortgages with conforming loan balances ($484,350 or less) decreased to 4.42 percent from 4.46 percent, with points increasing to 0.46 from 0.44 (including the origination fee) for 80 percent loan-to-value ratio (LTV) loans.
emphasis added
 Click on graph for larger image.
The first graph shows the refinance index since 1990.
Once mortgage rates fell more than 50 bps from the highs of last year, a number of recent buyers were able to refinance. But it would take another significant decrease in rates to see a further increase in refinance activity.
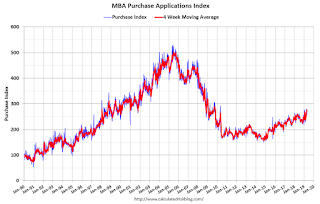 The second graph shows the MBA mortgage purchase index
According to the MBA, purchase activity is up 1% year-over-year.
Wednesday: ADP Employment, ISM Mfg Survey, Construction Spending, FOMC Announcement
by Calculated Risk on 5/01/2019 01:12:00 AM
Wednesday:
• At 7:00 AM ET: The Mortgage Bankers Association (MBA) will release the results for the mortgage purchase applications index.
• At All day: Light vehicle sales for April. The consensus is for light vehicle sales to be 17.0 million SAAR in April, down from 17.5 million in March (Seasonally Adjusted Annual Rate).
• At 8:15 AM: The ADP Employment Report for April. This report is for private payrolls only (no government). The consensus is for 180,000 payroll jobs added in April, up from 129,000 added in March.
• At 10:00 AM: ISM Manufacturing Index for April. The consensus is for the ISM to be at 55.0, down from 55.3 in March.
• At 10:00 AM: Construction Spending for March. The consensus is for a 0.2% increase in construction spending.
• At 2:00 PM: FOMC Meeting Announcement. No change to policy is expected at this meeting.
• At 2:30 PM: Fed Chair Jerome Powell holds a press briefing following the FOMC announcement.
Tuesday, April 30, 2019
Fannie Mae: Mortgage Serious Delinquency Rate Decreased in March
by Calculated Risk on 4/30/2019 06:24:00 PM
Fannie Mae reported that the Single-Family Serious Delinquency rate was decreased to 0.74% in March, from 0.76% in February. The serious delinquency rate is down from 1.16% in March 2018.
These are mortgage loans that are "three monthly payments or more past due or in foreclosure".
The Fannie Mae serious delinquency rate peaked in February 2010 at 5.59%.
This matches is the lowest serious delinquency rate for Fannie Mae since August 2007.
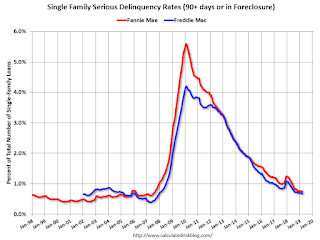
By vintage, for loans made in 2004 or earlier (3% of portfolio), 2.68% are seriously delinquent. For loans made in 2005 through 2008 (4% of portfolio), 4.50% are seriously delinquent, For recent loans, originated in 2009 through 2018 (93% of portfolio), only 0.33% are seriously delinquent. So Fannie is still working through poor performing loans from the bubble years.
The increase late last year in the delinquency rate was due to the hurricanes - there were no worries about the overall market.
I expect the serious delinquency rate will probably decline to 0.5 to 0.7 percent or so to a cycle bottom.
Note: Freddie Mac reported earlier.
Update: A few comments on the Seasonal Pattern for House Prices
by Calculated Risk on 4/30/2019 02:01:00 PM
CR Note: This is a repeat of earlier posts with updated graphs.
A few key points:
1) There is a clear seasonal pattern for house prices.
2) The surge in distressed sales during the housing bust distorted the seasonal pattern.
3) Even though distressed sales are down significantly, the seasonal factor is based on several years of data - and the factor is now overstating the seasonal change (second graph below).
4) Still the seasonal index is probably a better indicator of actual price movements than the Not Seasonally Adjusted (NSA) index.
For in depth description of these issues, see former Trulia chief economist Jed Kolko's article "Let’s Improve, Not Ignore, Seasonal Adjustment of Housing Data"
Note: I was one of several people to question the change in the seasonal factor (here is a post in 2009) - and this led to S&P Case-Shiller questioning the seasonal factor too (from April 2010). I still use the seasonal factor (I think it is better than using the NSA data).
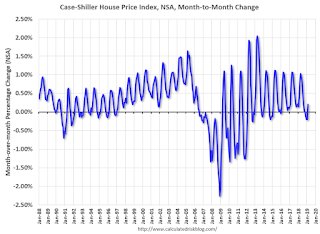
This graph shows the month-to-month change in the NSA Case-Shiller National index since 1987 (through February 2019). The seasonal pattern was smaller back in the '90s and early '00s, and increased once the bubble burst.
The seasonal swings have declined since the bubble.
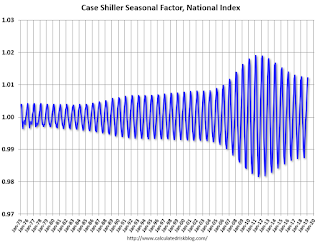
The swings in the seasonal factors has started to decrease, and I expect that over the next several years - as recent history is included in the factors - the seasonal factors will move back towards more normal levels.
However, as Kolko noted, there will be a lag with the seasonal factor since it is based on several years of recent data.
Real House Prices and Price-to-Rent Ratio in February
by Calculated Risk on 4/30/2019 11:53:00 AM
Here is the earlier post on Case-Shiller: Case-Shiller: National House Price Index increased 4.0% year-over-year in February
It has been over eleven years since the bubble peak. In the Case-Shiller release this morning, the seasonally adjusted National Index (SA), was reported as being 12.4% above the previous bubble peak. However, in real terms, the National index (SA) is still about 7.7% below the bubble peak (and historically there has been an upward slope to real house prices). The composite 20, in real terms, is still 14.5% below the bubble peak.
The year-over-year increase in prices has slowed to 4.0% nationally, and I expect price growth will slow some more.
Usually people graph nominal house prices, but it is also important to look at prices in real terms (inflation adjusted). Case-Shiller and others report nominal house prices. As an example, if a house price was $200,000 in January 2000, the price would be close to $286,000 today adjusted for inflation (43%). That is why the second graph below is important - this shows "real" prices (adjusted for inflation).
Nominal House Prices

In nominal terms, the Case-Shiller National index (SA)and the Case-Shiller Composite 20 Index (SA) are both at new all times highs (above the bubble peak).
Real House Prices
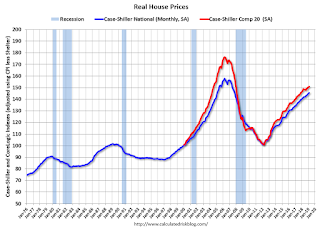
In real terms, the National index is back to February 2005 levels, and the Composite 20 index is back to July 2004.
In real terms, house prices are at 2004/2005 levels.
Price-to-Rent
In October 2004, Fed economist John Krainer and researcher Chishen Wei wrote a Fed letter on price to rent ratios: House Prices and Fundamental Value. Kainer and Wei presented a price-to-rent ratio using the OFHEO house price index and the Owners' Equivalent Rent (OER) from the BLS.

This graph shows the price to rent ratio (January 2000 = 1.0).
On a price-to-rent basis, the Case-Shiller National index is back to February 2004 levels, and the Composite 20 index is back to November 2003 levels.
In real terms, prices are back to late 2004 levels, and the price-to-rent ratio is back to late 2003, early 2004.
NAR: Pending Home Sales Index Increased 3.8% in March
by Calculated Risk on 4/30/2019 10:03:00 AM
From the NAR: Pending Home Sales Climb 3.8% in March
Pending home sales rose in March, reversing course from a month prior, according to the National Association of Realtors®. Three of the four major regions saw growth last month, as the Northeast reported a minor slip in contract activity.This was above expectations of a 0.6% increase for this index. Note: Contract signings usually lead sales by about 45 to 60 days, so this would usually be for closed sales in April and May.
The Pending Home Sales Index, a forward-looking indicator based on contract signings, increased 3.8% to 105.8 in March, up from 101.9 in February. Year-over-year contract signings declined 1.2%, making this the 15th straight month of annual decreases.
...
The PHSI in the Northeast declined 1.7% to 90.5 in March and is now 0.4% below a year ago. In the Midwest, the index grew 2.3% to 95.3 in March, 5.0% lower than March 2018.
Pending home sales in the South jumped up 4.4% to an index of 127.2 in March, which is 0.7% higher than last March. The index in the West ascended 8.7% in March to 95.1 and fell only 1.6% below a year ago.
emphasis added
Case-Shiller: National House Price Index increased 4.0% year-over-year in February
by Calculated Risk on 4/30/2019 09:10:00 AM
S&P/Case-Shiller released the monthly Home Price Indices for February ("February" is a 3 month average of December, January and February prices).
This release includes prices for 20 individual cities, two composite indices (for 10 cities and 20 cities) and the monthly National index.
Note: Case-Shiller reports Not Seasonally Adjusted (NSA), I use the SA data for the graphs.
From S&P: S&P CoreLogic Case-Shiller Index Shows Annual Gains Continue to Decline
The S&P CoreLogic Case-Shiller U.S. National Home Price NSA Index, covering all nine U.S. census divisions, reported a 4.0% annual gain in February, down from 4.2% in the previous month. The 10-City Composite annual increase came in at 2.6%, down from 3.1% in the previous month. The 20-City Composite posted a 3.0% year-over-year gain, down from 3.5% in the previous month.
Las Vegas, Phoenix and Tampa reported the highest year-over-year gains among the 20 cities. In February, Las Vegas led the way with a 9.7% year-over-year price increase, followed by Phoenix with a 6.7% increase, and Tampa with a 5.4% increase. Only one of the 20 cities reported greater price increases in the year ending February 2019 versus the year ending January 2019.
...
Before seasonal adjustment, the National Index posted a month-over-month increase of 0.2% in February. The 10-City and 20-City Composites both reported 0.2% increases for the month. After seasonal adjustment, the National Index recorded a 0.3% month-over-month increase in February. The 10-City and the 20-City Composites both posted 0.2% month-over-month increases. In February, 14 of 20 cities reported increases before seasonal adjustment, while 17 of 20 cities reported increases after seasonal adjustment.
“The pace of increases for home prices continues to slow,” says David M. Blitzer, Managing Director and Chairman of the Index Committee at S&P Dow Jones Indices. “Homes began their climb in 2012 and accelerated until late 2013 when annual increases reached double digits. Subsequently, increases slowed until now when the National Index is up 4% in the last 12 months. Sales of existing single family homes have recovered since 2010 and reached their peak one year ago in February 2018. Home sales drifted down over the last year except for a one-month pop in February 2019. Sales of new homes, housing starts, and residential investment had similar weak trajectories over the last year. Mortgage rates are down one-half to three-quarters of a percentage point since late 2018.
“The largest year-over-year price increase is 9.7% in Las Vegas; last year, the largest gain was 12.7% in Seattle. Regional patterns are shifting. The three California cities of Los Angeles, San Francisco and San Diego have the three slowest price increases over the last year. Chicago, New York and Cleveland saw only slightly larger prices increases than California. Prices generally rose faster in inland cities than on either the coasts or the Great Lakes. Aside from Las Vegas, Phoenix, and Tampa, which saw the fastest gains, Atlanta, Denver, and Minneapolis all saw prices rise more than 4% -- twice the rate of inflation.”
emphasis added
 Click on graph for larger image.
 The first graph shows the nominal seasonally adjusted Composite 10, Composite 20 and National indices (the Composite 20 was started in January 2000).
The Composite 10 index is up slightly from the bubble peak, and up 0.1% in February (SA).
The Composite 20 index is 4.0% above the bubble peak, and up 0.2% (SA) in February.
The National index is 12.4% above the bubble peak (SA), and up 0.3% (SA) in February. The National index is up 52.0% from the post-bubble low set in December 2011 (SA).
 The second graph shows the Year over year change in all three indices.
The Composite 10 SA is up 2.5% compared to February 2018. The Composite 20 SA is up 2.9% year-over-year.
The National index SA is up 4.0% year-over-year.
Note: According to the data, prices increased in 17 of 20 cities month-over-month seasonally adjusted.
I'll have more later.


