by Calculated Risk on 5/15/2019 07:00:00 AM
Wednesday, May 15, 2019
MBA: Mortgage Applications Decreased in Latest Weekly Survey
From the MBA: Mortgage Applications Decrease in Latest MBA Weekly Survey
Mortgage applications decreased 0.6 percent from one week earlier, according to data from the Mortgage Bankers Association’s (MBA) Weekly Mortgage Applications Survey for the week ending May 10, 2019.
... The Refinance Index decreased 1 percent from the previous week. The seasonally adjusted Purchase Index decreased 1 percent from one week earlier. The unadjusted Purchase Index decreased 1 percent compared with the previous week and was 7 percent higher than the same week one year ago.
...
“Purchase applications declined slightly last week but still remained almost 7 percent higher than a year ago,” said Joel Kan, MBA’s Associate Vice President of Economic and Industry Forecasting. “Despite the third straight decline in mortgage rates, refinance applications decreased for the fifth time in six weeks, albeit by less than 1 percent.”
Added Kan, “It’s worth watching if ongoing global trade disputes lead to increased anxiety about the economy, which could cause some potential homebuyers to put off their home search until the uncertainty is resolved.
...
The average contract interest rate for 30-year fixed-rate mortgages with conforming loan balances ($484,350 or less) decreased to 4.40 percent from 4.41 percent, with points decreasing to 0.40 from 0.47 (including the origination fee) for 80 percent loan-to-value ratio (LTV) loans.
emphasis added
 Click on graph for larger image.
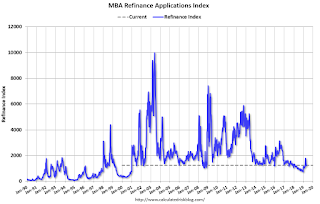
The first graph shows the refinance index since 1990.
Once mortgage rates fell more than 50 bps from the highs of last year, a number of recent buyers were able to refinance. But it would take another significant decrease in rates to see a further increase in refinance activity.
 The second graph shows the MBA mortgage purchase index
According to the MBA, purchase activity is up 7% year-over-year.
Tuesday, May 14, 2019
Wednesday: Retail Sales, Industrial Production, Homebuilder Survey, NY Fed Mfg
by Calculated Risk on 5/14/2019 09:29:00 PM
Wednesday:
• At 7:00 AM ET: The Mortgage Bankers Association (MBA) will release the results for the mortgage purchase applications index.
• At 8:30 AM: Retail sales for April is scheduled to be released. The consensus is for 0.3% increase in retail sales.
8:30 AM: The New York Fed Empire State manufacturing survey for May. The consensus is for a reading of 9.9, down from 10.1.
• At 9:15 AM: The Fed will release Industrial Production and Capacity Utilization for April. The consensus is for a no change in Industrial Production, and for Capacity Utilization to be unchanged at 78.8%.
• At 10:00 AM: The May NAHB homebuilder survey. Any number above 50 indicates that more builders view sales conditions as good than poor.
Los Angeles Area Home Sales Increased 1% YoY in April, Inventory up 10% YoY
by Calculated Risk on 5/14/2019 03:41:00 PM
From Pacific Union chief economist Selma Hepp: Spring has finally sprung in Los Angeles housing markets
After doldrum housing market activity in Los Angeles through the first quarter of 2019, April has finally brought some cheer. Number of homes sold compared to last year increased 1 percent overall, mostly driven by increases in sales of homes priced between $1 and $2 million (up 8 percent), and sales of homes priced below $1 million (up 2 percent). Higher priced homes (above $2 million) continue to trend below last year’s levels, but are still ahead compared to 2017 and 2016.CR Note: there is much more data at Hepp's report.
...
Availability of for-sale inventory continues to trend above last year, with inventories 10 percent ahead of last April and all price ranges posting similar year-over-year differences. However, while there are more homes to choose from overall, these are not homes newly listed in April. In fact, new listings in April are below last year’s, suggesting that some of the homes that are still available for sale have been taking longer to sell.
emphasis added
MBA: "Foreclosure inventory rate still at lowest level since 1995"
by Calculated Risk on 5/14/2019 12:57:00 PM
From the MBA: Mortgage Delinquencies Rise in the First Quarter of 2019
The delinquency rate for mortgage loans on one-to-four-unit residential properties rose to a seasonally adjusted rate of 4.42 percent of all loans outstanding at the end of the first quarter, according to the Mortgage Bankers Association’s (MBA) National Delinquency Survey.
Despite an uptick of 36 basis points on a quarterly basis, the delinquency rate was still down 21 basis points from one year ago. The percentage of loans on which foreclosure actions were started last quarter fell by 5 basis points from a year ago and 2 basis points from last quarter (to 0.23 percent).
“The national mortgage delinquency rate in the first quarter of 2019 was down on a year-over-year basis, which is another sign of a very strong economic environment, bolstered by low unemployment and rising wage growth,” said Marina Walsh, MBA’s Vice President of Industry Analysis. “Moreover, the serious delinquency rate – the percentage of loans that are 90 days or more past due or in the process of foreclosure – dropped across all loan types from the previous quarter and a year ago to its lowest overall level since the second quarter of 2006.”
Walsh noted that early 30-day delinquencies rose in the first quarter of 2019 on a seasonally-adjusted basis across all loan types. The rise in early delinquencies resulted in the overall mortgage delinquency rate climbing by 36 basis points. While higher than several quarters in 2017 and 2018, it is still the fourth lowest overall mortgage delinquency rate in the past 12 years.
...
By stage, the 30-day delinquency rate increased 29 basis points to 2.58 percent, the 60-day delinquency rate increased 7 basis points to 0.81 percent, and the 90-day delinquency bucket remained unchanged at 1.03 percent.
...
The delinquency rate includes loans that are at least one payment past due, but does not include loans in the process of foreclosure. The percentage of loans in the foreclosure process at the end of the first quarter was 0.92 percent, down 3 basis points from the fourth quarter and 24 basis points lower than one year ago. This is the lowest foreclosure inventory rate since the fourth quarter of 1995.
...
The serious delinquency rate, the percentage of loans that are 90 days or more past due or in the process of foreclosure, was at 1.96 percent – a decrease of 10 basis points from last quarter and a decrease of 65 basis points from last year.
emphasis added
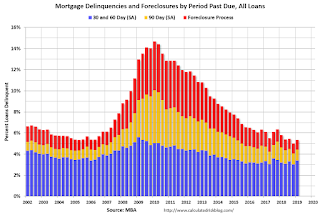
 Click on graph for larger image.
This graph shows the percent of loans delinquent by days past due. There was a small increase in delinquencies in Q1, but the overall level is low.
The percent of loans in the foreclosure process continues to decline, and is now at the lowest level since 1995.
NY Fed Q1 Report: "Total Household Debt Rises for 19th Straight Quarter, Now Nearly $1 Trillion Above Previous Peak"
by Calculated Risk on 5/14/2019 11:16:00 AM
From the NY Fed: Total Household Debt Rises for 19th Straight Quarter, Now Nearly $1 Trillion Above Previous Peak
The Federal Reserve Bank of New York’s Center for Microeconomic Data today issued its Quarterly Report on Household Debt and Credit, which shows that total household debt increased by $124 billion (0.9%) to $13.67 trillion in the first quarter of 2019. It was the 19th consecutive quarter with an increase, and the total is now $993 billion higher than the previous peak of $12.68 trillion in the third quarter of 2008. The Report is based on data from the New York Fed’s Consumer Credit Panel, a nationally representative sample of individual- and household-level debt and credit records drawn from anonymized Equifax credit data.
...
"The rate at which credit card balances become delinquent has been rising, and that has coincided with an increase in younger borrowers entering the credit card market,” said Andrew Haughwout, senior vice president at the New York Fed. “However, these delinquency rates are increasing from historically low levels and remain below pre-financial-crisis levels.”
…
Mortgage balances rose by $120 billion, to $9.2 trillion.
Mortgage originations declined to $344 billion from $401 billion, the lowest level seen since the third quarter of 2014.
Mortgage delinquencies improved slightly, with 1.0% of mortgage balances 90 or more days delinquent, down from 1.1% in the fourth quarter of 2018.
emphasis added
 Click on graph for larger image.
Here are two graphs from the report:
The first graph shows aggregate consumer debt increased in Q1. Household debt previously peaked in 2008, and bottomed in Q2 2013.
From the NY Fed:
Aggregate household debt balances ticked up in the first quarter of 2019 for the 19th consecutive quarter, and are now $993 billion (7.8%) higher than the previous (2008Q3) peak of $12.68 trillion. As of March 31, 2019, total household indebtedness was $13.67 trillion, a $124 billion (0.9%) increase from the fourth quarter of 2018. Overall household debt is now 22.5% above the 2013Q2 trough.
Mortgage balances shown on consumer credit reports on March 31 stood at $9.2 trillion, a $120 billion increase from 2018Q4. Balances on home equity lines of credit (HELOC) declined modestly, by $6 billion, continuing their declining trend from 2009. HELOC balances are now at $406 billion. Non-housing balances increased by $10 billion in the first quarter, with a small increase in auto loan balances ($6 billion), a $29 billion increase in student loan balances, offset by a $22 billion decline in credit card balances.
New extensions of credit for mortgage and auto loans slowed in the first quarter. Mortgage originations, which we measure as appearances of new mortgage balances on consumer credit reports and which include refinanced mortgages, were at $344 billion, a notable decline from the volume seen in 2018Q4 and the lowest quarterly volume observed since 2014Q3. There were $139 billion in newly originated auto loans in the first quarter of 2019, a modest decline from the fourth quarter but higher than the volume observed in 2018Q1. The aggregate credit card limit rose for the 25th consecutive quarter, with a 1.3% increase from 2018Q4.
 The second graph shows the percent of debt in delinquency.
The overall delinquency rate decreased slightly in Q1. From the NY Fed:
Aggregate delinquency rates remained steady in the first quarter of 2019. As of March 31, 4.6% of outstanding debt was in some stage of delinquency. Of the $623 billion of debt that is delinquent, $417 billion is seriously delinquent (at least 90 days late or “severely derogatory”). The flow into 90+ day delinquency for credit card balances has been rising since 2017, while the flow into 90+ day delinquency for auto loan balances has been slowly trending upward since as early as 2012. Student loan delinquency transition rates remain at high levels relative to other types of debt.There is much more in the report.
Small Business Optimism Index increased in April
by Calculated Risk on 5/14/2019 09:01:00 AM
CR Note: Most of this survey is noise, but there is some information, especially on the labor market and the "Single Most Important Problem".
From the National Federation of Independent Business (NFIB): April 2019 Report: Small Business Optimism Index
The Small Business Optimism Index improved, increasing 1.7 points to 103.5. One Index component fell, one was unchanged, and eight improved.
..
More new jobs were created in April, although at a slower pace than in the last quarter, with a net addition of 0.32 workers per firm.
…
Twenty-four percent of owners cited the difficulty of finding qualified workers as their Single Most Important Business Problem, 1 point below the record high.
emphasis added
 Click on graph for larger image.
This graph shows the small business optimism index since 1986.
The index increased to 103.5 in April.
Note: Usually small business owners complain about taxes and regulations (currently 2nd and 3rd on the "Single Most Important Problem" list). However, during the recession, "poor sales" was the top problem. Now the difficulty of finding qualified workers is the top problem.
Monday, May 13, 2019
Tuesday: NY Fed Quarterly Report on Household Debt and Credit, Small Business Index
by Calculated Risk on 5/13/2019 08:19:00 PM
Tuesday:
• At 6:00 AM ET, NFIB Small Business Optimism Index for April.
• At 11:00 AM, NY Fed: Q1 Quarterly Report on Household Debt and Credit
"Lowest Mortgage Rates in More Than a Month"
by Calculated Risk on 5/13/2019 05:20:00 PM
From Matthew Graham at Mortgage News Daily: Lowest Mortgage Rates in More Than a Month
Mortgage rates moved moderately lower to start the new week as trade tensions remained in focus. In general, the worse the US/China trade relationship is looking at any given moment, the better it has been for the bond market (and the worse it's been for stocks).CR Note: The decline in mortgage rates - from around 5% late last year, to just over 4% - has given the housing market a lift.
…
Today's drop brings the average lender back to the lowest rates since April 2. [30YR FIXED - 4.125-4.25%]
Trends in Educational Attainment in the U.S. Labor Force
by Calculated Risk on 5/13/2019 12:51:00 PM
The first graph shows the unemployment rate by four levels of education (all groups are 25 years and older) through April 2019.
Unfortunately this data only goes back to 1992 and includes only two recessions (the stock / tech bust in 2001, and the housing bust/financial crisis). Clearly education matters with regards to the unemployment rate - and all four groups are generally trending down.

Note: This says nothing about the quality of jobs - as an example, a college graduate working at minimum wage would be considered "employed".
This brings up an interesting question: What is the composition of the labor force by educational attainment, and how has that been changing over time?
Note: Thanks to Tim Duy, Economics Professor at the University of Oregon, and Josh Lehner, at the Oregon Office of Economic Analysis.
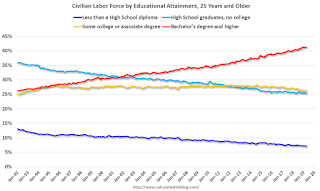
Here is some data on the U.S. labor force by educational attainment since 1992.

This is the only category trending up. "Some college" has declined recently, and both "high school" and "less than high school" have been trending down for some time.
Based on current trends, probably more than half the labor force will have at least a bachelor's degree around 2030 or so.
Some thoughts: Since workers with bachelor's degrees typically have a lower unemployment rate, this is probably a factor in pushing down the overall unemployment rate over time.
Also, I'd guess more education means less labor turnover, and that education is a factor in fewer weekly claims (I haven't seen data on unemployment claims by education).
A more educated labor force is one of the reasons I remain optimistic about the future.
LA area Port Traffic Down Year-over-year in April
by Calculated Risk on 5/13/2019 10:08:00 AM
Special note: The expansion to the Panama Canal was completed in 2016 (As I noted a few years ago), and some of the traffic that used the ports of Los Angeles and Long Beach is probably going through the canal. This might be impacting TEUs on the West Coast.
On the impact of the trade war, from Port of Long Beach Executive Director Mario Cordero: “With peak season approaching, we’re expecting imports to continue to grow, but it’s clear exports are suffering under the weight of tariffs.” emphasis added
Container traffic gives us an idea about the volume of goods being exported and imported - and usually some hints about the trade report since LA area ports handle about 40% of the nation's container port traffic.
The following graphs are for inbound and outbound traffic at the ports of Los Angeles and Long Beach in TEUs (TEUs: 20-foot equivalent units or 20-foot-long cargo container).
To remove the strong seasonal component for inbound traffic, the first graph shows the rolling 12 month average.

On a rolling 12 month basis, inbound traffic was up 0.1% in April compared to the rolling 12 months ending in March. Outbound traffic was down 0.8% compared to the rolling 12 months ending the previous month.
The 2nd graph is the monthly data (with a strong seasonal pattern for imports).

In general imports have been increasing, and exports have mostly moved sideways over the last 8 years.


