by Calculated Risk on 5/22/2019 07:00:00 AM
Wednesday, May 22, 2019
MBA: Mortgage Applications Increased in Latest Weekly Survey
From the MBA: Mortgage Applications Increase in Latest MBA Weekly Survey
Mortgage applications increased 2.4 percent from one week earlier, according to data from the Mortgage Bankers Association’s (MBA) Weekly Mortgage Applications Survey for the week ending May 17, 2019.
... The Refinance Index increased 8 percent from the previous week. The seasonally adjusted Purchase Index decreased 2 percent from one week earlier. The unadjusted Purchase Index decreased 3 percent compared with the previous week and was 7 percent higher than the same week one year ago.
...
“Mortgage rates fell for the fourth straight week, with the 30-year fixed rate mortgage hitting its lowest level since January 2018, leading to a rebound in refinances. The refinance index increased 8 percent to its highest level in over a month, and once again there was an increase in average refinance loan sizes, as borrowers with larger balances responded accordingly to lower rates,” said Joel Kan, MBA’s Associate Vice President of Economic and Industry Forecasting. “Purchase activity declined again, but remained around 7 percent higher than a year ago. We’re keeping a close eye on whether there may be some adverse effects of the ongoing global trade disputes on overall demand. Some potential homebuyers may be delaying their home search until there’s more certainty.”
...
The average contract interest rate for 30-year fixed-rate mortgages with conforming loan balances ($484,350 or less) decreased to 4.33 percent from 4.40 percent, with points increasing to 0.43 from 0.40 (including the origination fee) for 80 percent loan-to-value ratio (LTV) loans.
emphasis added
 Click on graph for larger image.
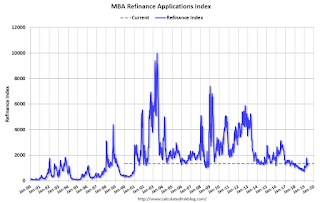
The first graph shows the refinance index since 1990.
Once mortgage rates fell more than 50 bps from the highs of last year, a number of recent buyers were able to refinance. But it would take another significant decrease in rates to see a further increase in refinance activity.
 The second graph shows the MBA mortgage purchase index
According to the MBA, purchase activity is up 7% year-over-year.
Tuesday, May 21, 2019
Wednesday: FOMC Minutes
by Calculated Risk on 5/21/2019 08:14:00 PM
Wednesday:
• At 7:00 AM ET, The Mortgage Bankers Association (MBA) will release the results for the mortgage purchase applications index.
• During the day, The AIA's Architecture Billings Index for April (a leading indicator for commercial real estate).
• At 2:00 PM, FOMC Minutes, Meeting of April 30-May 1, 2019
Chemical Activity Barometer Increased Slightly in May
by Calculated Risk on 5/21/2019 04:07:00 PM
Note: This appears to be a leading indicator for industrial production.
From the American Chemistry Council: Chemical Activity Barometer Shows Third Monthly Gain in May
The Chemical Activity Barometer (CAB), a leading economic indicator created by the American Chemistry Council (ACC), rose 0.4 percent in May on a three-month moving average (3MMA) basis, the third monthly gain after several weak months. On a year-over-year (Y/Y) basis, the barometer is up 0.5 percent (3MMA).
...
"Year-earlier comparisons have turned positive in recent months, and while trade tensions, slowing economic growth overseas, and soft economic reports in the U.S. have created uncertainty that has weighed on business investment, the CAB signals gains in U.S. commercial and industrial activity through mid-2019, albeit at a moderate pace,” said Kevin Swift, chief economist at ACC. “There is some possibility of improving activity in the closing months of the year.”
...
Applying the CAB back to 1912, it has been shown to provide a lead of two to fourteen months, with an average lead of eight months at cycle peaks as determined by the National Bureau of Economic Research. The median lead was also eight months. At business cycle troughs, the CAB leads by one to seven months, with an average lead of four months. The median lead was three months. The CAB is rebased to the average lead (in months) of an average 100 in the base year (the year 2012 was used) of a reference time series. The latter is the Federal Reserve’s Industrial Production Index.
emphasis added
 Click on graph for larger image.
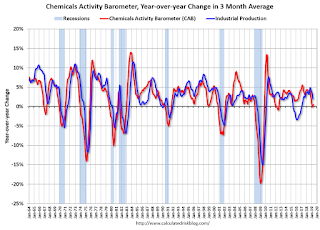
This graph shows the year-over-year change in the 3-month moving average for the Chemical Activity Barometer compared to Industrial Production. It does appear that CAB (red) generally leads Industrial Production (blue).
The year-over-year increase in the CAB suggests that the YoY increase in industrial production will probably slow further.
Comments on April Existing Home Sales
by Calculated Risk on 5/21/2019 01:28:00 PM
Earlier: NAR: Existing-Home Sales Decreased to 5.19 million in April
A few key points:
1) The key for housing - and the overall economy - is new home sales, single family housing starts and overall residential investment.
Overall, this is still a somewhat reasonable level for existing home sales. No worries.
2) Inventory is still low, and was only up 1.7% year-over-year (YoY) in April. This was the ninth consecutive month with a year-over-year increase in inventory, although the YoY increase was smaller in April than in the six previous months.

3) Year-to-date sales are down about 4.9% compared to the same period in 2018. On an annual basis, that would put sales around 5.1 million in 2019. Sales slumped at the end of 2018 and in January 2019 due to higher mortgage rates, the stock market selloff, and fears of an economic slowdown (unfounded).
The comparisons will be easier towards the end of the year.

Sales NSA in April (455,000, red column) were below sales in April 2018 (460,000, NSA), but sales were higher than in April 2017..
NAR: Existing-Home Sales Decreased to 5.19 million in April
by Calculated Risk on 5/21/2019 10:11:00 AM
From the NAR: Existing-Home Sales Inch Back 0.4% in April
Existing-home sales saw a minor decline in April, continuing March’s drop in sales, according to the National Association of Realtors®. Two of the four major U.S. regions saw a slight dip in sales, while the West saw growth and the Midwest essentially bore no changes last month.
Total existing-home sales, completed transactions that include single-family homes, townhomes, condominiums and co-ops, fell 0.4% from March to a seasonally adjusted annual rate of 5.19 million in April. Total sales are down 4.4% from a year ago (5.43 million in April 2018).
...
Total housing inventory at the end of April increased to 1.83 million, up from 1.67 million existing homes available for sale in March and a 1.7% increase from 1.80 million a year ago. Unsold inventory is at a 4.2-month supply at the current sales pace, up from 3.8 months in March and up from 4.0 months in April 2018.
emphasis added
 Click on graph for larger image.
This graph shows existing home sales, on a Seasonally Adjusted Annual Rate (SAAR) basis since 1993.
Sales in April (5.19 million SAAR) were down 0.4% from last month, and were 4.4% below the April 2018 sales rate.
The second graph shows nationwide inventory for existing homes.
 According to the NAR, inventory increased to 1.83 million in April from 1.67 million in March. Headline inventory is not seasonally adjusted, and inventory usually decreases to the seasonal lows in December and January, and peaks in mid-to-late summer.
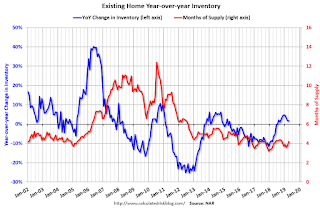
The last graph shows the year-over-year (YoY) change in reported existing home inventory and months-of-supply. Since inventory is not seasonally adjusted, it really helps to look at the YoY change. Note: Months-of-supply is based on the seasonally adjusted sales and not seasonally adjusted inventory.
 Inventory was up 1.7% year-over-year in April compared to April 2018.
 Months of supply was at 4.2 months in April.
This was below the consensus forecast. For existing home sales, a key number is inventory - and inventory is still low. I'll have more later …
Black Knight: National Mortgage Delinquency Rate Decreased to Record Low in April
by Calculated Risk on 5/21/2019 08:51:00 AM
From Black Knight: Black Knight’s First Look: Strong April Mortgage Performance Pushes National Delinquency Rate to New Record Low; Prepayment Activity Continues to Rise
• Following a slow start to the year, the national delinquency rate fell by more than 5% month-over-month; at 3.47%, it is now at its lowest level on record dating back to 2000According to Black Knight's First Look report for April, the percent of loans delinquent decreased 5.0% in April compared to March, and decreased 5.4% year-over-year.
• Serious delinquencies – loans 90 or more days past due, but not yet in foreclosure – fell to 474,000, marking a 124,000 year-over-year decline and a 12-year low
• While monthly foreclosure starts edged up slightly from March’s 18-year low, the number of loans in active foreclosure continued to shrink, hitting a more than 13-year low in April
• Prepayment activity continues to press upward, driven by a combination of low interest rates and seasonal increases in home sale activity
• The prepayment rate on first-lien mortgages rose 17% from March, bringing the three-month aggregate increase to 67%
The percent of loans in the foreclosure process decreased 2.2% in April and were down 18.8% over the last year.
Black Knight reported the U.S. mortgage delinquency rate (loans 30 or more days past due, but not in foreclosure) was 3.47% in April, down from 3.65% in March.
The percent of loans in the foreclosure process decreased slightly in April to 0.50% from 0.51% in March.
The number of delinquent properties, but not in foreclosure, is down 73,000 properties year-over-year, and the number of properties in the foreclosure process is down 55,000 properties year-over-year.
| Black Knight: Percent Loans Delinquent and in Foreclosure Process | ||||
|---|---|---|---|---|
| Apr 2019 | Mar 2019 | Apr 2018 | Apr 2017 | |
| Delinquent | 3.47% | 3.65% | 3.67% | 4.08% |
| In Foreclosure | 0.50% | 0.51% | 0.61% | 0.85% |
| Number of properties: | ||||
| Number of properties that are delinquent, but not in foreclosure: | 1,812,000 | 1,903,000 | 1,885,000 | 2,072,000 |
| Number of properties in foreclosure pre-sale inventory: | 259,000 | 264,000 | 314,000 | 433,000 |
| Total Properties | 2,072,000 | 2,167,000 | 2,199,000 | 2,505,000 |
Monday, May 20, 2019
Tuesday: Existing Home Sales
by Calculated Risk on 5/20/2019 06:40:00 PM
From Matthew Graham at Mortgage News Daily: Mortgage Rates Mostly Hold Near Lows, But Things Could Change Tomorrow
Much of the credit for the recent drop in rates goes to the well-publicized trade tensions between the US and China. As the cycle of inflammatory headlines dies down, so too does the motivation for interest rates to remain as low as they have been. Granted, this is far from the only source of inspiration for interest rate movement, but it has probably been the biggest motivation over the past 2 weeks. [30YR FIXED - 4.0% - 4.125%]Tuesday:
emphasis added
• At 10:00 AM ET, Existing Home Sales for April from the National Association of Realtors (NAR). The consensus is for 5.36 million SAAR, up from 5.21 million. Housing economist Tom Lawler expects the NAR to report sales of 5.31 million SAAR for April.
The Changing Mix of Light Vehicle Sales
by Calculated Risk on 5/20/2019 03:03:00 PM
SUVs to the left of me, SUVs to the right. It made me look at the changing mix of vehicle sales over time (between passenger cars and light trucks / SUVs).
The first graph below shows the mix of sales since 1976 (Blue is cars, Red is light trucks and SUVs).
Click on graph for larger image.
The mix has changed significantly. Back in 1976, most light vehicles were passenger cars - however car sales have trended down over time.
Note that the big dips in sales are related to economic recessions (early '80s, early '90s, and the Great Recession of 2007 through mid-2009).

Over time the mix has changed toward more and more light trucks and SUVs.
Only when oil prices are high, does the trend slow or reverse.
Recently oil prices have been somewhat steady, and the percent of light trucks and SUVs is up to 71%.
Quarterly Housing Starts by Intent
by Calculated Risk on 5/20/2019 10:46:00 AM
Here is a graph I haven't updated in some time. From the Census Bureau "Started and Completed by Purpose of Construction" through Q1 2019.
This graph shows the NSA quarterly intent for four start categories since 1975: single family built for sale, owner built (includes contractor built for owner), starts built for rent, and condos built for sale.

Single family starts built for sale were down about 4% in Q1 2019 compared to Q1 2018.
Owner built starts were down about 6.5% year-over-year.
And condos built for sale not far above the record low.
The 'units built for rent' (blue) had increased significantly following the great recession, but are now moving mostly sideways - and were down 18% in Q1 2019 compared to Q1 2018.
Chicago Fed "Index Points to Slower Economic Growth in April"
by Calculated Risk on 5/20/2019 08:54:00 AM
From the Chicago Fed: Index Points to Slower Economic Growth in April
Led by declines in production-related indicators, the Chicago Fed National Activity Index (CFNAI) fell to –0.45 in April from +0.05 in March. Three of the four broad categories of indicators that make up the index decreased from March, and two of the four categories made negative contributions to the index in April. The index’s three-month moving average, CFNAI-MA3, moved down to –0.32 in April from –0.24 in March.This graph shows the Chicago Fed National Activity Index (three month moving average) since 1967.
emphasis added
 Click on graph for larger image.
This suggests economic activity was below the historical trend in April (using the three-month average).
According to the Chicago Fed:
The index is a weighted average of 85 indicators of growth in national economic activity drawn from four broad categories of data: 1) production and income; 2) employment, unemployment, and hours; 3) personal consumption and housing; and 4) sales, orders, and inventories.
...
A zero value for the monthly index has been associated with the national economy expanding at its historical trend (average) rate of growth; negative values with below-average growth (in standard deviation units); and positive values with above-average growth.


