by Calculated Risk on 5/28/2019 12:09:00 PM
Tuesday, May 28, 2019
Update: A few comments on the Seasonal Pattern for House Prices
CR Note: This is a repeat of earlier posts with updated graphs.
A few key points:
1) There is a clear seasonal pattern for house prices.
2) The surge in distressed sales during the housing bust distorted the seasonal pattern.
3) Even though distressed sales are down significantly, the seasonal factor is based on several years of data - and the factor is now overstating the seasonal change (second graph below).
4) Still the seasonal index is probably a better indicator of actual price movements than the Not Seasonally Adjusted (NSA) index.
For in depth description of these issues, see former Trulia chief economist Jed Kolko's article "Let’s Improve, Not Ignore, Seasonal Adjustment of Housing Data"
Note: I was one of several people to question the change in the seasonal factor (here is a post in 2009) - and this led to S&P Case-Shiller questioning the seasonal factor too (from April 2010). I still use the seasonal factor (I think it is better than using the NSA data).

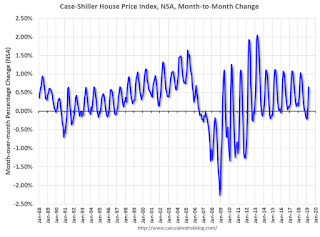
This graph shows the month-to-month change in the NSA Case-Shiller National index since 1987 (through March 2019). The seasonal pattern was smaller back in the '90s and early '00s, and increased once the bubble burst.
The seasonal swings have declined since the bubble.

The swings in the seasonal factors has started to decrease, and I expect that over the next several years - as recent history is included in the factors - the seasonal factors will move back towards more normal levels.
However, as Kolko noted, there will be a lag with the seasonal factor since it is based on several years of recent data.
Dallas Fed: "Texas Manufacturing Expansion Continues but Pace Slows"
by Calculated Risk on 5/28/2019 10:36:00 AM
From the Dallas Fed: Texas Manufacturing Expansion Continues but Pace Slows
Texas factory activity continued to expand in May, albeit at a slower pace, according to business executives responding to the Texas Manufacturing Outlook Survey. The production index, a key measure of state manufacturing conditions, fell six points to 6.3, indicating output growth decelerated from April.This was the worst reading for the general activity index since 2016.
Most other measures of manufacturing activity also suggested slower expansion in May. The survey’s demand indicators fell but remained positive: The new orders index slipped seven points to 2.4, and the growth rate of orders index moved down from 5.2 to 1.1. The capacity utilization index fell to 7.7 from a seven-month high of 15.6 in April. Meanwhile, the shipments index edged up to 7.6.
Perceptions of broader business conditions exhibited some weakness in May. The general business activity index turned negative and reached a year-to-date low of -5.3. The company outlook index dipped into negative territory for the first time this year, coming in at -1.7. The index measuring uncertainty regarding companies’ outlooks jumped nine points to 16.1, its highest reading since last September. More than a quarter of firms said uncertainty increased this month.
Labor market measures suggested stronger employment growth and longer workweeks in May. The employment index rebounded from its April dip, rising seven points to 11.6.
emphasis added
Case-Shiller: National House Price Index increased 3.7% year-over-year in March
by Calculated Risk on 5/28/2019 09:10:00 AM
S&P/Case-Shiller released the monthly Home Price Indices for March ("March" is a 3 month average of January, February and March prices).
This release includes prices for 20 individual cities, two composite indices (for 10 cities and 20 cities) and the monthly National index.
Note: Case-Shiller reports Not Seasonally Adjusted (NSA), I use the SA data for the graphs.
From S&P: S&P CoreLogic Case-Shiller Index Shows Annual Home Price Gains Continue to Weaken
The S&P CoreLogic Case-Shiller U.S. National Home Price NSA Index, covering all nine U.S. census divisions, reported a 3.7% annual gain in March, down from 3.9% in the previous month. The 10-City Composite annual increase came in at 2.3%, down from 2.5% in the previous month. The 20-City Composite posted a 2.7% year-over-year gain, down from 3.0% in the previous month.
Las Vegas, Phoenix and Tampa reported the highest year-over-year gains among the 20 cities. In March, Las Vegas led the way with an 8.2% year-over-year price increase, followed by Phoenix with a 6.1% increase, and Tampa with a 5.3% increase. Four of the 20 cities reported greater price increases in the year ending March 2019 versus the year ending February 2019.
...
Before seasonal adjustment, the National Index posted a month-over-month increase of 0.6% in March. The 10-City and 20-City Composites both reported 0.7% increases for the month. After seasonal adjustment, the National Index recorded a 0.3% month-over-month increase in March. The 10-City and 20-City Composites both posted 0.1% month-over-month increases. In March, 19 of 20 cities reported increases before seasonal adjustment, while 14 of 20 cities reported increases after seasonal adjustment.
“Home price gains continue to slow,” says David M. Blitzer, Managing Director and Chairman of the Index Committee at S&P Dow Jones Indices. “The patterns seen in the last year or more continue: year-over-year price gains in most cities are consistently shrinking. Double-digit annual gains have vanished. The largest annual gain was 8.2% in Las Vegas; one year ago, Seattle had a 13% gain. In this report, Seattle prices are up only 1.6%. The 20-City Composite dropped from 6.7% to 2.7% annual gains over the last year as well. The shift to smaller price increases is broad-based and not limited to one or two cities where large price increases collapsed.
emphasis added
 Click on graph for larger image.
 The first graph shows the nominal seasonally adjusted Composite 10, Composite 20 and National indices (the Composite 20 was started in January 2000).
The Composite 10 index is up slightly from the bubble peak, and up 0.1% in March (SA).
The Composite 20 index is 4.2% above the bubble peak, and up 0.1% (SA) in March.
The National index is 12.6% above the bubble peak (SA), and up 0.3% (SA) in March. The National index is up 52.3% from the post-bubble low set in December 2011 (SA).
 The second graph shows the Year over year change in all three indices.
The Composite 10 SA is up 2.3% compared to March 2018. The Composite 20 SA is up 2.6% year-over-year.
The National index SA is up 3.7% year-over-year.
Note: According to the data, prices increased in 15 of 20 cities month-over-month seasonally adjusted.
I'll have more later.
Tuesday: Case-Shiller House Prices
by Calculated Risk on 5/28/2019 12:11:00 AM
Tuesday:
• At 9:00 AM, S&P/Case-Shiller House Price Index for March. The consensus is for a 2.5% year-over-year increase in the Comp 20 index for March.
• At 9:00 AM, FHFA House Price Index for March 2019. This was originally a GSE only repeat sales, however there is also an expanded index.
• At 10:30 AM, Dallas Fed Survey of Manufacturing Activity for May.
Monday, May 27, 2019
The War on Data Continues
by Calculated Risk on 5/27/2019 10:33:00 AM
Three years ago I wrote: The War on Data
Unfortunately the war on data has continued unabated, as Catherine Rampell noted last week in the WaPo: The Trump administration’s war on statistics isn’t slowing down
Don’t like the numbers? Invent new numbers instead.There are no "alternative facts", and this war on data should concern everyone - ignoring or misrepresenting data leads to irresponsible comments and poor policy decisions.
Or make it harder to collect trustworthy numbers next time.
Or just put the squeeze on the number crunchers themselves.
Slowly but surely, the Trump administration has been chipping away at the independence and integrity of our federal statistical agencies, whose data is critical to keeping our democracy functioning and our economy healthy.
…
Presumably the Trump administration has calculated that doctoring statistical models, skewing survey results and trying to strong-arm statisticians will serve its near-term political interests. In the long term, however, sowing distrust in government data only reduces the ability of policymakers, businesses and voters to make informed decisions.
Sunday, May 26, 2019
Hotels: Occupancy Rate Increased Year-over-year
by Calculated Risk on 5/26/2019 10:14:00 AM
From HotelNewsNow.com: STR: US hotel results for week ending 18 May
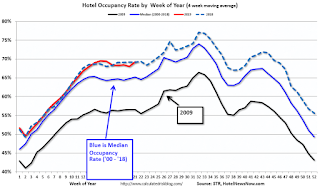
The U.S. hotel industry reported positive year-over-year results in the three key performance metrics during the week of 12-18 May 2019, according to data from STR.The following graph shows the seasonal pattern for the hotel occupancy rate using the four week average.
In comparison with the week of 13-19 May 2018, the industry recorded the following:
• Occupancy: +0.8% to 70.8%
• Average daily rate (ADR): +1.4% to US$134.36
• Revenue per available room (RevPAR): +2.2% to US$95.13
emphasis added
 Click on graph for larger image.
The red line is for 2019, dash light blue is 2018, blue is the median, and black is for 2009 (the worst year probably since the Great Depression for hotels).
A decent start for 2019, close - to-date - compared to the previous 4 years.
Seasonally, the occupancy rate will mostly move sideways for several more weeks, and then increase during the Summer travel season.
Data Source: STR, Courtesy of HotelNewsNow.com
Saturday, May 25, 2019
Schedule for Week of May 26, 2019
by Calculated Risk on 5/25/2019 08:11:00 AM
The key reports this week are the second estimate of Q1 GDP, Case-Shiller house prices, and Personal Income and Outlays for April.
For manufacturing, the May Dallas and Richmond Fed manufacturing surveys will be released.
All US markets will be closed in observance of Memorial Day.
 9:00 AM: S&P/Case-Shiller House Price Index for March.
This graph shows the year-over-year change in the seasonally adjusted National Index, Composite 10 and Composite 20 indexes through the most recent report (the Composite 20 was started in January 2000).
The consensus is for a 2.5% year-over-year increase in the Comp 20 index for March.
9:00 AM: FHFA House Price Index for March 2019. This was originally a GSE only repeat sales, however there is also an expanded index.
10:30 AM: Dallas Fed Survey of Manufacturing Activity for May.
7:00 AM ET: The Mortgage Bankers Association (MBA) will release the results for the mortgage purchase applications index.
10:00 AM: Richmond Fed Survey of Manufacturing Activity for May. This is the last of regional manufacturing surveys for May.
8:30 AM: The initial weekly unemployment claims report will be released. The consensus is for 215 thousand initial claims, up from 211 thousand last week.
8:30 AM: Gross Domestic Product, 1st quarter 2019 (Second estimate). The consensus is that real GDP increased 3.0% annualized in Q2, down from the advance estimate of 3.2%.
10:00 AM: Pending Home Sales Index for April. The consensus is for a 0.3% increase in the index.
8:30 AM ET: Personal Income and Outlays, April 2019. The consensus is for a 0.3% increase in personal income, and for a 0.2% increase in personal spending. And for the Core PCE price index to increase 0.2%.
9:45 AM: Chicago Purchasing Managers Index for May.
10:00 AM: University of Michigan's Consumer sentiment index (Final for May). The consensus is for a reading of 101.0.
Friday, May 24, 2019
Oil Prices Down Year-over-year
by Calculated Risk on 5/24/2019 05:24:00 PM
From MarketWatch: Oil futures suffer worst weekly performance of the year
Oil futures settled higher Friday, recouping a portion of recent losses, but a day after posting their biggest one-day loss since December, prices saw their worst weekly performance of the year.
…
Brent shed 4.6%, while WTI was down by 5.7%, on Thursday — the biggest daily losses since December. The week’s losses for both were also the largest year to date.
 Click on graph for larger image
The first graph shows WTI and Brent spot oil prices from the EIA. (Prices today added).
According to Bloomberg, WTI is at $59.02 per barrel today, and Brent is at $69.27.
Prices collapsed in 2008 due to the financial crisis, and then increased as the economy recovered. Oil prices collapsed again in 2014 and 2015, mostly due to oversupply.
 The second graph shows the year-over-year change in WTI based on data from the EIA.
Six times since 1987, oil prices have increased 100% or more YoY. And several times prices have almost fallen in half YoY.
Currently WTI is down 18% year-over-year, but up sharply from the lows at the of 2018.
Oil prices are volatile!
Q2 GDP Forecasts: Mid 1% Range
by Calculated Risk on 5/24/2019 11:25:00 AM
From Merrill Lynch:
We lowered 2Q GDP tracking by 0.2pp to 1.6%, while 1Q remained unchanged at 2.9% [May 24 estimate]From Goldman Sachs:
emphasis added
We lowered our Q2 GDP tracking estimate by two tenths to +1.3% and our past-quarter GDP tracking estimate for Q1 by one tenth to +3.0% (qoq ar). [Updated: May 24 estimate]From the NY Fed Nowcasting Report
The New York Fed Staff Nowcast stands at 1.4% for 2019:Q2. News from this week's data releases decreased the nowcast for 2019:Q2 by 0.4 percentage point. Negative surprises from the Advance Durable Goods Report drove most of the decrease. [May 24 estimate].And from the Altanta Fed: GDPNow
The GDPNow model estimate for real GDP growth (seasonally adjusted annual rate) in the second quarter of 2019 is 1.3 percent on May 24, up from 1.2 percent on May 16. [May 24 estimate]CR Note: These early estimates suggest real GDP growth will be in the mid-1% range annualized in Q2.
Housing and Recessions
by Calculated Risk on 5/24/2019 10:55:00 AM
Now that new home sales have reached a new cycle high (in March), I'd like to update a couple of graphs in a previous post (most of this from an earlier post).
For the economy, what we should be focused on are single family starts and new home sales. As I noted in Investment and Recessions "New Home Sales appears to be an excellent leading indicator, and currently new home sales (and housing starts) are up solidly year-over-year, and this suggests there is no recession in sight."
For the bottoms and troughs for key housing activity, here is a graph of Single family housing starts, New Home Sales, and Residential Investment (RI) as a percent of GDP.

The arrows point to some of the earlier peaks and troughs for these three measures.
The purpose of this graph is to show that these three indicators generally reach peaks and troughs together. Note that Residential Investment is quarterly and single-family starts and new home sales are monthly.
RI as a percent of GDP has been sluggish recently.
Also, look at the relatively low level of RI as a percent of GDP, new home sales and single family starts compared to previous peaks. To have a significant downturn from these levels would be surprising.

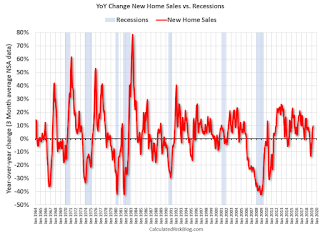
Note: the New Home Sales data is smoothed using a three month centered average before calculating the YoY change. The Census Bureau data starts in 1963.
Some observations:
1) When the YoY change in New Home Sales falls about 20%, usually a recession will follow. The one exception for this data series was the mid '60s when the Vietnam buildup kept the economy out of recession. Note that the sharp decline in 2010 was related to the housing tax credit policy in 2009 - and was just a continuation of the housing bust.
2) It is also interesting to look at the '86/'87 and the mid '90s periods. New Home sales fell in both of these periods, although not quite 20%. As I noted in earlier posts, the mid '80s saw a surge in defense spending and MEW that more than offset the decline in New Home sales. In the mid '90s, nonresidential investment remained strong.
Although new home sales were down towards the end of 2018, the decline wasn't that large historically. As I noted last Fall, I wasn't even on recession watch. Now new home sales are up year-over-year. No worries.


