by Calculated Risk on 6/04/2019 02:04:00 PM
Tuesday, June 04, 2019
BEA: May Vehicles Sales increase to 17.3 Million SAAR
The BEA released their estimate of May vehicle sales this morning. The BEA estimated sales of 17.31 million SAAR in May 2019 (Seasonally Adjusted Annual Rate), up 5.9% from the April sales rate, and up slightly from May 2018.
Sales in 2019 are averaging 16.8 million (average of seasonally adjusted rate), down 1.9% compared to the same period in 2018.

This graph shows light vehicle sales since 2006 from the BEA (blue) and an estimate for May (red).
This was below the consensus forecast for April.
A small decline in sales to date this year isn't a concern - I think sales will move mostly sideways at near record levels.
This means the economic boost from increasing auto sales is over (from the bottom in 2009, auto sales boosted growth every year through 2016).

Note: dashed line is current estimated sales rate of 17.31 million SAAR.
Fed Chair Powell: Closely monitoring trade negotiations, Will act "as appropriate"
by Calculated Risk on 6/04/2019 09:58:00 AM
From Fed Chair Jerome Powell: Opening Remarks
I’d like first to say a word about recent developments involving trade negotiations and other matters. We do not know how or when these issues will be resolved. We are closely monitoring the implications of these developments for the U.S. economic outlook and, as always, we will act as appropriate to sustain the expansion, with a strong labor market and inflation near our symmetric 2 percent objective. My comments today, like this conference, will focus on longer-run issues that will remain even as the issues of the moment evolve.
CoreLogic: House Prices up 3.6% Year-over-year in April
by Calculated Risk on 6/04/2019 08:37:00 AM
Notes: This CoreLogic House Price Index report is for April. The recent Case-Shiller index release was for March. The CoreLogic HPI is a three month weighted average and is not seasonally adjusted (NSA).
From CoreLogic: CoreLogic Reports April Home Prices Increased by 3.6% Year Over Year
CoreLogic® ... today released the CoreLogic Home Price Index (HPI™) and HPI Forecast™ for April 2019, which shows home prices rose both year over year and month over month. Home prices increased nationally by 3.6% from April 2018. On a month-over-month basis, prices increased by 1% in April 2019. (March 2019 data was revised. Revisions with public records data are standard, and to ensure accuracy, CoreLogic incorporates the newly released public data to provide updated results each month.)
Looking ahead, after several months of moderation in early 2019, the CoreLogic HPI Forecast indicates home prices will begin to pick up and increase by 4.7% from April 2019 to April 2020. On a month-over-month basis, home prices are expected to decrease by 0.3% from April 2019 to May 2019. The CoreLogic HPI Forecast is a projection of home prices calculated using the CoreLogic HPI and other economic variables. Values are derived from state-level forecasts by weighting indices according to the number of owner-occupied households for each state.
“The pickup in sales between March and April, has helped to counter the recent slowing in annual home-price growth,” said Dr. Frank Nothaft, chief economist at CoreLogic. “Mortgage rates are 0.6 percentage points below what they were one year ago and incomes are up, which has improved affordability for buyers. However, price growth has remained the highest for lower-priced homes, constraining housing choices for first-time buyers.”
emphasis added
 CR Note: The CoreLogic YoY increase had been in the 5% to 7% range for several years, before slowing last year. The slight pickup in the YoY appreciation is the first "acceleration" since March 2018.
The year-over-year comparison has been positive for more than seven years since turning positive year-over-year in February 2012.
Monday, June 03, 2019
Tuesday: Auto Sales, Fed Chair Powell Opening Remarks
by Calculated Risk on 6/03/2019 07:38:00 PM
From Matthew Graham at Mortgage News Daily: Mortgage Rates Continue to Plummet
Mortgage rates dropped quickly again today, easily hitting the lowest levels since late 2017 for the average lender. [Today's Most Prevalent Rates 30YR FIXED - 3.875%]Tuesday:
emphasis added
• All day, Light vehicle sales for May. The consensus is for light vehicle sales to be 16.9 million SAAR in April, up from 16.4 million in April (Seasonally Adjusted Annual Rate).
• At 9:55 AM, Speech by Fed Chair Jerome Powell, Opening Remarks, Monetary Policy Strategy, Tools, and Communication Practices, At the Conference on Monetary Policy Strategy, Tools, and Communication Practices (A Fed Listens Event), Federal Reserve Bank of Chicago, Chicago, Illinois (Watch here)
• At 10:00 AM, Corelogic House Price index for April.
Update: Framing Lumber Prices Down Almost 50% Year-over-year
by Calculated Risk on 6/03/2019 03:00:00 PM
Here is another monthly update on framing lumber prices. Lumber prices declined from the record highs in early 2018, and are now down almost 50% year-over-year.
This graph shows two measures of lumber prices: 1) Framing Lumber from Random Lengths through May 31, 2019 (via NAHB), and 2) CME framing futures.

Right now Random Lengths prices are down 44% from a year ago, and CME futures are down 49% year-over-year.
There is a seasonal pattern for lumber prices, and usually prices will increase in the Spring, and peak around May, and then bottom around October or November - although there is quite a bit of seasonal variability.
The trade war is a factor with reports that lumber exports to China have declined by 40% since last September.
Construction Spending Mostly Unchanged in April
by Calculated Risk on 6/03/2019 11:59:00 AM
From the Census Bureau reported that overall construction spending was mostly unchanged in April:
Construction spending during April 2019 was estimated at a seasonally adjusted annual rate of $1,298.5 billion, nearly the same as the revised March estimate of $1,299.2 billion. The April figure is 1.2 percent below the April 2018 estimate of $1,314.7 billion.Private spending decreased and public spending increased:
Spending on private construction was at a seasonally adjusted annual rate of $954.0 billion, 1.7 percent below the revised March estimate of $970.4 billion. ...
In April, the estimated seasonally adjusted annual rate of public construction spending was $344.6 billion, 4.8 percent above the revised March estimate of $328.7 billion.
emphasis added
 Click on graph for larger image.
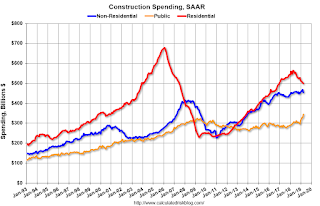
This graph shows private residential and nonresidential construction spending, and public spending, since 1993. Note: nominal dollars, not inflation adjusted.
Private residential spending had been increasing - but turned down in the 2nd half of 2018 - and is now 26% below the bubble peak.
Non-residential spending is 10% above the previous peak in January 2008 (nominal dollars).
Public construction spending is 6% above the previous peak in March 2009, and 32% above the austerity low in February 2014.
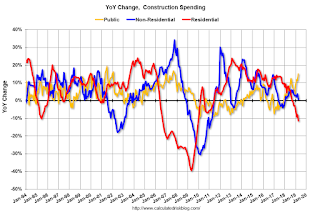
 The second graph shows the year-over-year change in construction spending.
On a year-over-year basis, private residential construction spending is down 11%. Non-residential spending is up slightly year-over-year. Public spending is up 15% year-over-year.
This was below consensus expectations, however spending for February and March were revised up (mostly public spending).
ISM Manufacturing index Decreased to 52.1 in May
by Calculated Risk on 6/03/2019 10:04:00 AM
The ISM manufacturing index indicated expansion in May. The PMI was at 52.1% in May, down from 52.8% in April. The employment index was at 53.7%, up from 52.4% last month, and the new orders index was at 52.7%, up from 51.7%.
From the Institute for Supply Management: May 2019 Manufacturing ISM® Report On Business®
Economic activity in the manufacturing sector expanded in May, and the overall economy grew for the 121st consecutive month, say the nation’s supply executives in the latest Manufacturing ISM® Report On Business®.
The report was issued today by Timothy R. Fiore, CPSM, C.P.M., Chair of the Institute for Supply Management® (ISM®) Manufacturing Business Survey Committee: “The May PMI® registered 52.1 percent, a decrease of 0.7 percentage point from the April reading of 52.8 percent. The New Orders Index registered 52.7 percent, an increase of 1 percentage point from the April reading of 51.7 percent. The Production Index registered 51.3 percent, a 1-percentage point decrease compared to the April reading of 52.3 percent. The Employment Index registered 53.7 percent, an increase of 1.3 percentage points from the April reading of 52.4 percent. The Supplier Deliveries Index registered 52 percent, a 2.6-percentage point decrease from the April reading of 54.6 percent. The Inventories Index registered 50.9 percent, a decrease of 2 percentage points from the April reading of 52.9 percent. The Prices Index registered 53.2 percent, a 3.2-percentage point increase from the April reading of 50 percent.
emphasis added
 Click on graph for larger image.
Here is a long term graph of the ISM manufacturing index.
This was below expectations of 52.9%, and suggests manufacturing expanded at a slower pace in May than in April.
Black Knight Mortgage Monitor for March: Record Low National Delinquency Rate
by Calculated Risk on 6/03/2019 08:46:00 AM
Black Knight released their Mortgage Monitor report for April today. According to Black Knight, 3.47% of mortgages were delinquent in April, down from 3.67% in April 2018. Black Knight also reported that 0.50% of mortgages were in the foreclosure process, down from 0.61% a year ago.
This gives a total of 3.97% delinquent or in foreclosure.
Press Release: Black Knight Reports Home Price Growth Continues to Slow, Falling Below 25-Year Average for First Time Since 2012; Affordability at Strongest Point in More Than a Year
Today, the Data & Analytics division of Black Knight, Inc. released its latest Mortgage Monitor Report, based upon the company’s industry-leading mortgage performance, housing and public records datasets. This month, leveraging its McDash loan-level mortgage performance data in combination with the Black Knight Home Price Index (HPI), the company revisited the home price and affordability landscape. As Black Knight’s Data & Analytics Division President Ben Graboske explained, home prices continued their trend of deceleration in March, but lower interest rates over the past three months have brought affordability to its best point in more than a year.
“In what is usually the calendar-year high point for home price gains, month-over-month appreciation in March 2019 was just 1%, down from 1.25% at the same time last year,” said Graboske. “Likewise, the annual rate of appreciation has now slipped to 3.8%, the first time annual home price growth has fallen below its 25-year average of 3.9% since 2012. That makes 13 consecutive months of home price deceleration. As we’ve been reporting, home prices began to decelerate in February 2018 as rising interest rates started putting pressure on affordability. The situation intensified in the last half of the year as 30-year fixed rates peaked near 5% in November, bringing affordability levels close to their long-term averages. Of course, rates have since declined, and are now hovering close to 4%. However, they didn’t fall below 4.25% until the last week of March, meaning we likely won’t see the impact – if any – on home prices until May or June housing numbers.
“Regardless, falling rates have already had a positive impact on affordability. In fact, the monthly payment needed to purchase the average-priced home with a 20% down payment has declined by 6% in the last six months. It currently requires $1,173 per month to make that purchase, the lowest such payment in more than a year. When we factor income into the equation, we see that it takes 22% of the median income to purchase the average-priced home. That’s the lowest payment-to-income ratio in more than a year as well, and far below the long-term average of 25.1%. That the market reacted in terms of slowing home price growth even before we hit that long-term average suggests that a 25% payment-to-income ratio may not be sustainable in today’s market, whether due to excess non-mortgage related debt, lending standards or other factors.”
emphasis added
 Click on graph for larger image.
Here is a graph from the Mortgage Monitor that shows the National delinquency rate over time.
From Black Knight:
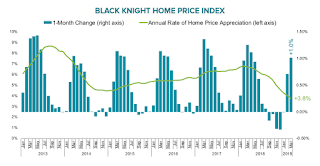
• After seeing delinquencies decline by less than 6% over the first three months of 2019 – the lowest seasonal improvement to start any year on record – April made up for lost groundThe second graph shows the one month change in house prices as calculated by Black Knight, and the year-over-year change:
• April marked a record-low for the national delinquency rate
• The national delinquency rate declined by 5% in April alone, bringing the aggregate 2019 YTD improvement to -10.6%

• In March – a month that typically sees the largest home price gains of the year – prices rose by just 1%, marking 13 consecutive months of home price decelerationThere is much more in the mortgage monitor.
• The annual rate of appreciation has now slipped to 3.8%, the first time annual home price growth has fallen below its 25-year average of 3.9% since 2012
• Home prices began to decelerate in February 2018 as rising interest rates put pressure on affordability, intensifying toward the end of the year as 30-year fixed rates peaked near 5% in November
• Rates have since declined, and are now hovering close to 4%; however, they didn’t fall below 4.25% until the last week of March, meaning we likely won’t see the impact – if any – on home prices until May or June housing numbers are available
Sunday, June 02, 2019
Monday: ISM Manufacturing, Construction Spending
by Calculated Risk on 6/02/2019 07:44:00 PM
Weekend:
• Schedule for Week of June 2, 2019
Monday:
• At 10:00 AM ET, ISM Manufacturing Index for May. The consensus is for the ISM to be at 52.9, up from 52.8 in April. The employment index was at 52.4% in April, and the new orders index was at 51.7%.
• Also at 10:00 AM, Construction Spending for April. The consensus is for a 0.5% increase in construction spending.
From CNBC: Pre-Market Data and Bloomberg futures: S&P 500 are down 15 and DOW futures are down 164 (fair value).
Oil prices were down over the last week with WTI futures at $52.81 per barrel and Brent at $61.19 per barrel. A year ago, WTI was at $66, and Brent was at $75 - so oil prices are down about 20% year-over-year.
Here is a graph from Gasbuddy.com for nationwide gasoline prices. Nationally prices are at $2.81 per gallon. A year ago prices were at $2.96 per gallon, so gasoline prices are down about 5% year-over-year.
May 2019: Unofficial Problem Bank list unchanged at 73 Institutions
by Calculated Risk on 6/02/2019 10:31:00 AM
Note: Surferdude808 compiles an unofficial list of Problem Banks compiled only from public sources.
Here is the unofficial problem bank list for May 2019.
Here are the monthly changes and a few comments from surferdude808:
Update on the Unofficial Problem Bank List for May 2019. It was very quiet during the month as there were no changes to the list this month. At the end of May, the Unofficial Problem Bank stood at 73 institutions with assets of $52.1 billion, down from 92 intuitions but up in assets of $18.0 billion from a year ago.
However, two interesting events occurred during the month related to the list. First, on May 29th, the FDIC released industry results for the first quarter of 2019. Within that release, the FDIC said the Official Problem Bank List held 59 institutions with assets of $46.7 billion. Second, the Enloe State Bank, Cooper, Texas ($36.7 million) failed on Friday, May 31st. This is the first failure since January 2018, stretch of 15 months. Notable about this failure is that the Enloe State Bank, founded in June 1928 and supervised by the FDIC, is that it does not appear that FDIC issued a formal safety & soundness enforcement action to address Enloe’s weaknesses.


