by Calculated Risk on 6/27/2019 01:18:00 PM
Thursday, June 27, 2019
Reis: Apartment Vacancy Rate unchanged in Q2 at 4.7%
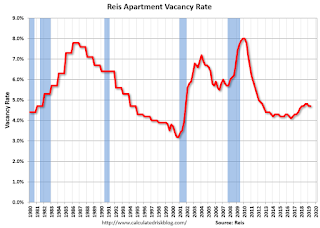
Reis reported that the apartment vacancy rate was at 4.7% in Q2 2019, unchanged from 4.7% in Q1, and unchanged from 4.7% in Q2 2018. The vacancy rate peaked at 8.0% at the end of 2009, and bottomed at 4.1% in 2016.
From chief economist Victor Calanog at Reis:
The apartment vacancy rate was flat in the quarter at 4.7% - a zero net change from a year ago. After climbing 60 basis points from a low of 4.1% in Q3 2016, the vacancy rate has remained near 4.7% since the first quarter of 2018.
The national average asking rent increased 1.2% in the second quarter while effective rent, which nets out landlord concessions, increased 1.3%. At $1,471 per unit (asking) and $1,400 per unit (effective), the average rents both increased 4.3%, from the second quarter of 2018.
...
Apartment occupancy growth had accelerated in 2018 after slowing a bit in 2017. At the same time, the housing market slumped in the latter half of 2018 after gaining some heat in 2017. Thus far, in 2019, existing home sales have fluctuated a bit, yet at higher levels than year-end 2018; apartment occupancy growth has once again been subdued. We had attributed the acceleration in the apartment market in 2018 to the tax cut at the end of 2017 that reduced the incentive to buy a home. Many have cited falling mortgage rates to the housing market spikes that occurred in February and again in May.
Despite having vacancies rise from 4.1% in the middle of 2016 to its current 4.7%, the apartment market has weathered the relatively strong influx of new supply very well. Performance has not been as brisk as recent peak years of 2014 (for lease-up velocity, when new buildings were achieving stabilization to market occupancy in 3 to 6 months - today it is closer to 9 to 15 months) and 2015 (for rent growth, which peaked at 5.8% for asking rents and 5.7% for effective rents). However, with construction slowing as soon as later this year and throughout 2020 for many major markets, continuing robust demand for rentals will likely manifest in vacancy rates that stay well in the 4s, or at most, rise to the low 5s. What may complicate this story is if the economy runs into any kind of contraction in the next 18 months.
emphasis added
 Click on graph for larger image.
This graph shows the apartment vacancy rate starting in 1980. (Annual rate before 1999, quarterly starting in 1999). Note: Reis is just for large cities.
The vacancy rate had mostly moved sideways for the last year and half - after increasing from the low in 2016..
Apartment vacancy data courtesy of Reis.
Kansas City Fed: "Tenth District Manufacturing Activity Flat"
by Calculated Risk on 6/27/2019 11:00:00 AM
From the Kansas City Fed: Tenth District Manufacturing Activity Flat
The Federal Reserve Bank of Kansas City released the June Manufacturing Survey today. According to Chad Wilkerson, vice president and economist at the Federal Reserve Bank of Kansas City, the survey revealed that Tenth District manufacturing activity was flat in June, while expectations for future activity remained solid.This was the last of the regional Fed surveys for June.
“Regional factory growth was relatively flat,” said Wilkerson. “However, nearly 70 percent of manufacturing contacts reported confidence in the U.S. economy, and a majority have not changed their 2019 plans for employment and capital spending.”
...
The month-over-month composite index was 0 in June, slightly lower than 4 in May and 5 in April. The composite index is an average of the production, new orders, employment, supplier delivery time, and raw materials inventory indexes. The change in manufacturing activity was mostly driven by a decline at durable production plants, especially for computers, electronic products, and transportation equipment. Most month-over-month indexes edged lower in June, with a number of indexes decreasing, including the materials inventory index. However, the new orders index inched higher. Nearly all of the year-over-year factory indexes decreased to their lowest levels since late 2016, and the composite index fell from 23 to 4.
emphasis added
Here is a graph comparing the regional Fed surveys and the ISM manufacturing index:
 Click on graph for larger image.
The New York and Philly Fed surveys are averaged together (yellow, through June), and five Fed surveys are averaged (blue, through June) including New York, Philly, Richmond, Dallas and Kansas City. The Institute for Supply Management (ISM) PMI (red) is through May (right axis).
The regional surveys were mostly weak in June, and based on these regional surveys, it seems likely the ISM manufacturing index will be lower in June than in May - perhaps close to 50.
NAR: "Pending Home Sales Bounce Back 1.1% in May"
by Calculated Risk on 6/27/2019 10:03:00 AM
From the NAR: Pending Home Sales Bounce Back 1.1% in May
Pending home sales increased in May, a positive variation from the minor sales dip seen in the previous month, according to the National Association of Realtors®. Three of the four major regions saw growth in contract activity, with the West experiencing a slight sales decline.This was above expectations of a 0.6% increase for this index. Note: Contract signings usually lead sales by about 45 to 60 days, so this would usually be for closed sales in June and July.
The Pending Home Sales Index, a forward-looking indicator based on contract signings, climbed 1.1% to 105.4 in May, up from 104.3 in April. Year-over-year contract signings declined 0.7%, marking the 17th straight month of annual decreases.
...
The PHSI in the Northeast rose 3.5% to 92.0 in May and is now 0.5% below a year ago. In the Midwest, the index grew 3.6% to 100.3 in May, 1.2% lower than May 2018.
Pending home sales in the South inched up 0.1% to an index of 124.1 in May, which is 0.7% higher than last May. The index in the West dropped 1.8% in May to 91.8 and decreased 3.1% below a year ago.
emphasis added
Weekly Initial Unemployment Claims increased to 227,000
by Calculated Risk on 6/27/2019 08:35:00 AM
The DOL reported:
In the week ending June 22, the advance figure for seasonally adjusted initial claims was 227,000, an increase of 10,000 from the previous week's revised level. The previous week's level was revised up by 1,000 from 216,000 to 217,000. The 4-week moving average was 221,250, an increase of 2,250 from the previous week's revised average. The previous week's average was revised up by 250 from 218,750 to 219,000.The previous week was revised up.
emphasis added
The following graph shows the 4-week moving average of weekly claims since 1971.
 Click on graph for larger image.
The dashed line on the graph is the current 4-week average. The four-week average of weekly unemployment claims increased to 221,250.
This was higher than the consensus forecast.
Wednesday, June 26, 2019
Thursday: GDP, Unemployment Claims, Pending Home Sales
by Calculated Risk on 6/26/2019 07:19:00 PM
Thursday:
• At 8:30 AM: The initial weekly unemployment claims report will be released. The consensus is for 218 thousand initial claims, up from 216 thousand last week.
• At 8:30 AM: Gross Domestic Product, 1st quarter 2019 (Third estimate). The consensus is that real GDP increased 3.1% annualized in Q1, unchanged from the second estimate of 3.1%.
• At 10:00 AM: Pending Home Sales Index for May. The consensus is for a 0.6% increase in the index.
• At 11:00 AM: the Kansas City Fed manufacturing survey for June. This is the last of regional manufacturing surveys for June.
Zillow Case-Shiller Forecast: Same YoY Price Gains in May as in April
by Calculated Risk on 6/26/2019 04:31:00 PM
The Case-Shiller house price indexes for April were released yesterday. Zillow forecasts Case-Shiller a month early, and I like to check the Zillow forecasts since they have been pretty close.
From Matthew Speakman at Zillow: April Case-Shiller Results and May Forecast: Getting Back to Normal
The housing market has continued to normalize throughout the spring, finding more balance between buyers and sellers and slowing to a pace of growth much more in line with historic norms.The Zillow forecast is for the year-over-year change for the Case-Shiller National index to be at 3.5% in May, the same as in April.
The Zillow forecast is for the 20-City index to decline to 2.4% YoY in May from 2.5% in April, and for the 10-City index to decline to 2.2% YoY compared to 2.3% YoY in April.
Chemical Activity Barometer "Flat" in June
by Calculated Risk on 6/26/2019 02:00:00 PM
Note: This appears to be a leading indicator for industrial production.
From the American Chemistry Council:
Chemical Activity Barometer Is Flat In June
The Chemical Activity Barometer (CAB), a leading economic indicator created by the American Chemistry Council (ACC), was flat (0.0 percent change) in June on a three-month moving average (3MMA) basis, following three monthly gains. On a year-over-year (Y/Y) basis, the barometer is up 0.3 percent (3MMA).
...
“The slowing economy and rising trade tensions have weighed on business confidence and investment, resulting in mixed manufacturing activity,” said Kevin Swift, chief economist at ACC. “In summary, the CAB reading continues to signal gains in U.S. commercial and industrial activity through late 2019, but at a moderated pace.”
...
Applying the CAB back to 1912, it has been shown to provide a lead of two to fourteen months, with an average lead of eight months at cycle peaks as determined by the National Bureau of Economic Research. The median lead was also eight months. At business cycle troughs, the CAB leads by one to seven months, with an average lead of four months. The median lead was three months. The CAB is rebased to the average lead (in months) of an average 100 in the base year (the year 2012 was used) of a reference time series. The latter is the Federal Reserve’s Industrial Production Index.
emphasis added
 Click on graph for larger image.
This graph shows the year-over-year change in the 3-month moving average for the Chemical Activity Barometer compared to Industrial Production. It does appear that CAB (red) generally leads Industrial Production (blue).
The year-over-year increase in the CAB suggests that the YoY increase in industrial production will probably slow further.
Real House Prices and Price-to-Rent Ratio in April
by Calculated Risk on 6/26/2019 10:56:00 AM
Here is the post yesterday on Case-Shiller: Case-Shiller: National House Price Index increased 3.5% year-over-year in April
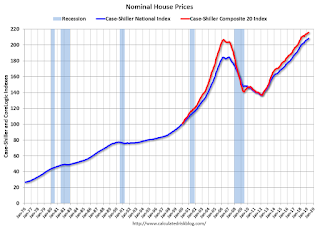
It has been over eleven years since the bubble peak. In the Case-Shiller release yesterday, the seasonally adjusted National Index (SA), was reported as being 12.9% above the previous bubble peak. However, in real terms, the National index (SA) is still about 7.9% below the bubble peak (and historically there has been an upward slope to real house prices). The composite 20, in real terms, is still 14.7% below the bubble peak.
The year-over-year increase in prices has slowed to 3.5% nationally, and I expect price growth will slow a little more, but not turn negative this year.
Usually people graph nominal house prices, but it is also important to look at prices in real terms (inflation adjusted). Case-Shiller and others report nominal house prices. As an example, if a house price was $200,000 in January 2000, the price would be close to $287,000 today adjusted for inflation (43%). That is why the second graph below is important - this shows "real" prices (adjusted for inflation).
Nominal House Prices

In nominal terms, the Case-Shiller National index (SA)and the Case-Shiller Composite 20 Index (SA) are both at new all times highs (above the bubble peak).
Real House Prices

In real terms, the National index is back to January 2005 levels, and the Composite 20 index is back to June 2004.
In real terms, house prices are at 2004/2005 levels.
Price-to-Rent
In October 2004, Fed economist John Krainer and researcher Chishen Wei wrote a Fed letter on price to rent ratios: House Prices and Fundamental Value. Kainer and Wei presented a price-to-rent ratio using the OFHEO house price index and the Owners' Equivalent Rent (OER) from the BLS.

This graph shows the price to rent ratio (January 2000 = 1.0).
On a price-to-rent basis, the Case-Shiller National index is back to February 2004 levels, and the Composite 20 index is back to October 2003 levels.
In real terms, prices are back to late 2004 levels, and the price-to-rent ratio is back to late 2003, early 2004.
MBA: Mortgage Applications Increased in Latest Weekly Survey
by Calculated Risk on 6/26/2019 07:00:00 AM
From the MBA: Mortgage Applications Increase in Latest MBA Weekly Survey
Mortgage applications increased 1.3 percent from one week earlier, according to data from the Mortgage Bankers Association’s (MBA) Weekly Mortgage Applications Survey for the week ending June 21, 2019.
... The Refinance Index increased 3 percent from the previous week. The seasonally adjusted Purchase Index decreased 1 percent from one week earlier. The unadjusted Purchase Index decreased 2 percent compared with the previous week and was 9 percent higher than the same week one year ago.
...
“Markets last week reacted to a more dovish FOMC statement and forecast, with Treasury yields falling after the meeting. Mortgage rates dropped again for most loan types, which led to an increase in refinance activity, partly driven by a 9 percent jump in VA applications,” said Joel Kan, MBA’s Associate Vice President of Economic and Industry Forecasting. “The 30-year fixed rate has now dropped in three of the last four weeks, and at 4.06 percent, reached its lowest level since September 2017. Despite these lower rates, purchase applications decreased 2 percent, but were still considerably higher (9 percent) than a year ago.”
Added Kan, “Now at almost the half-way mark of 2019, we have generally seen a stronger purchase market than last year, despite still-tight existing inventory and insufficient new construction.”
...
The average contract interest rate for 30-year fixed-rate mortgages with conforming loan balances ($484,350 or less) decreased to 4.06 percent from 4.14 percent, with points decreasing to 0.35 from 0.38 (including the origination fee) for 80 percent loan-to-value ratio (LTV) loans.
emphasis added
 Click on graph for larger image.
The first graph shows the refinance index since 1990.
Mortgage rates have declined from close to 5% late last year to around 4% now.
Just about anyone who bought or refinanced over the last year or so can refinance now. But it would take another significant decline in rates for a further large increase in refinance activity.
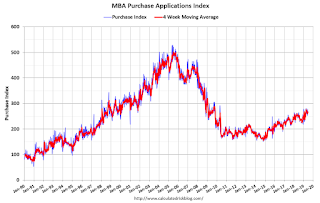
 The second graph shows the MBA mortgage purchase index
According to the MBA, purchase activity is up 9% year-over-year.
Tuesday, June 25, 2019
Freddie Mac: Mortgage Serious Delinquency Rate Decreased in May
by Calculated Risk on 6/25/2019 05:41:00 PM
Freddie Mac reported that the Single-Family serious delinquency rate in May was 0.63%, down from 0.65% in April. Freddie's rate is down from 0.87% in May 2018.
Freddie's serious delinquency rate peaked in February 2010 at 4.20%.
This is the lowest serious delinquency rate for Freddie Mac since November 2007.
These are mortgage loans that are "three monthly payments or more past due or in foreclosure".

I expect the delinquency rate to decline to a cycle bottom in the 0.4% to 0.6% range - so this is close to a bottom.
Note: Fannie Mae will report for May soon.


