by Calculated Risk on 7/25/2019 07:26:00 PM
Thursday, July 25, 2019
Friday: Q2 GDP
From Merrill Lynch today:
"On balance, this morning's data resulted in a net drag of 0.4pp on 2Q GDP tracking and brought our estimate down to 1.9% qoq saar from 2.3%."Friday:
• At 8:30 AM ET, Gross Domestic Product, 2nd quarter 2019 (advance estimate), and annual update. The consensus is that real GDP increased 1.9% annualized in Q2, down from 3.1% in Q1.
New Home Prices
by Calculated Risk on 7/25/2019 04:28:00 PM
As part of the new home sales report released yesterday, the Census Bureau reported the number of homes sold by price and the average and median prices.
From the Census Bureau: "The median sales price of new houses sold in June 2019 was $310,400. The average sales price was $368,600."
The following graph shows the median and average new home prices.

During the housing bust, the builders had to build smaller and less expensive homes to compete with all the distressed sales. When housing started to recovery - with limited finished lots in recovering areas - builders moved to higher price points to maximize profits.
Now it appears the home builders are offering some less expensive (and probably smaller) homes.
The average price in June 2019 2018 was $368,600, and the median price was $310,400.
The second graph shows the percent of new homes sold by price.

The $400K+ bracket increased significantly since the housing recovery started, but has started to decline. Still, a majority of new homes (about 53%) in the U.S., are in the $200K to $400K range.
Kansas City Fed: "Tenth District Manufacturing Largely Unchanged Again in July"
by Calculated Risk on 7/25/2019 11:00:00 AM
From the Kansas City Fed: Tenth District Manufacturing Largely Unchanged Again in July
The Federal Reserve Bank of Kansas City released the July Manufacturing Survey today. According to Chad Wilkerson, vice president and economist at the Federal Reserve Bank of Kansas City, the survey revealed that Tenth District manufacturing activity was largely unchanged in July, while expectations for future activity remained moderately positive.Another weak regional report.
“Regional factory growth remained basically flat this month, and a number of firms noted increased uncertainty because of trade concerns and weaker domestic demand,” said Wilkerson. “However, nearly 80 percent of manufacturing contacts reported confidence in their local economy.”
...
The month-over-month composite index was -1 in July, similar to the reading of 0 in June and slightly lower than an index of 4 in May. The composite index is an average of the production, new orders, employment, supplier delivery time, and raw materials inventory indexes. The small change in manufacturing activity was mostly driven by a decline at durable production plants, including computers, electronic products, appliances, and miscellaneous manufacturing. Most month-over-month indexes edged lower in July, and the new orders, employment, and finished goods inventory indexes turned negative. However, the volume of shipments was flat after last month’s slowdown, and supplier delivery time increased. Nearly all of the year-over-year factory indexes increased, and the composite index rose from 4 to 11. The future composite index remained moderately positive, inching down from 11 to 9, while expectations for production, new orders, and capital expenditures edged higher.
emphasis added
HVS: Q2 2019 Homeownership and Vacancy Rates
by Calculated Risk on 7/25/2019 10:05:00 AM
The Census Bureau released the Residential Vacancies and Homeownership report for Q2 2019.
This report is frequently mentioned by analysts and the media to track household formation, the homeownership rate, and the homeowner and rental vacancy rates. However, there are serious questions about the accuracy of this survey.
This survey might show the trend, but I wouldn't rely on the absolute numbers. he Census Bureau is investigating the differences between the HVS, ACS and decennial Census, and analysts probably shouldn't use the HVS to estimate the excess vacant supply or household formation, or rely on the homeownership rate, except as a guide to the trend.
"National vacancy rates in the second quarter 2019 were 6.8 percent for rental housing and 1.3 percent for homeowner housing. The rental vacancy rate of 6.8 percent was virtually unchanged from the rate in the second quarter 2018 and not statistically different from the rate in the first quarter 2019 (7.0 percent). The homeowner vacancy rate of 1.3 percent was 0.2 percentage points lower than the rate in the second quarter 2018 (1.5 percent), but not statistically different from the rate in the first quarter 2019 (1.4 percent).
The homeownership rate of 64.1 percent was not statistically different from the rate in the second quarter 2018 (64.3 percent) nor from the rate in the first quarter 2019 (64.2 percent). "
 Click on graph for larger image.
The Red dots are the decennial Census homeownership rates for April 1st 1990, 2000 and 2010. The HVS homeownership rate decreased to 64.1% in Q2, from 64.2% in Q1.
I'd put more weight on the decennial Census numbers. However, given changing demographics, the homeownership rate has bottomed.
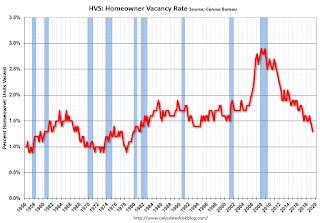 The HVS homeowner vacancy decreased to 1.3% in Q2.
 Once again - this probably shows the general trend, but I wouldn't rely on the absolute numbers.
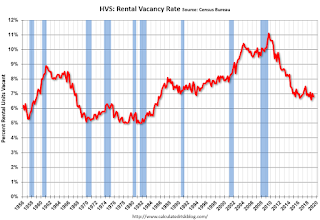 The rental vacancy rate decreased to 6.8% in Q2.
The quarterly HVS is the most timely survey on households, but there are many questions about the accuracy of this survey.
Overall this suggests that vacancies have declined significantly, and my guess is the homeownership rate has bottomed - and that the rental vacancy rate is close to the bottom for this cycle.
Weekly Initial Unemployment Claims decreased to 206,000
by Calculated Risk on 7/25/2019 08:34:00 AM
The DOL reported:
In the week ending July 20, the advance figure for seasonally adjusted initial claims was 206,000, a decrease of 10,000 from the previous week's unrevised level of 216,000. The 4-week moving average was 213,000, a decrease of 5,750 from the previous week's unrevised average of 218,750.The previous week was unrevised.
emphasis added
The following graph shows the 4-week moving average of weekly claims since 1971.
 Click on graph for larger image.
The dashed line on the graph is the current 4-week average. The four-week average of weekly unemployment claims decreased to 213,000.
This was lower than the consensus forecast.
Wednesday, July 24, 2019
Thursday: Unemployment Claims, Durable Goods, Q2 Homeownership, Kansas City Fed Mfg
by Calculated Risk on 7/24/2019 07:41:00 PM
Thursday:
• At 8:30 AM ET, The initial weekly unemployment claims report will be released. The consensus is for 210 thousand initial claims, down from 216 thousand last week.
• Also at 8:30 AM, Durable Goods Orders for June from the Census Bureau. The consensus is for a 0.7% increase in durable goods orders.
• At 10:00 AM, The Q2 2019 Housing Vacancies and Homeownership report from the Census Bureau.
• At 11:00 AM, the Kansas City Fed manufacturing survey for July. This is the last of regional manufacturing surveys for June.
New Home Sales and Recessions
by Calculated Risk on 7/24/2019 04:37:00 PM
I've been asked to update the second graph in this post: Housing and Recessions
As I noted in earlier posts, when the YoY change in New Home Sales falls about 20%, a recession will usually follow. The one exception for this data series was the mid '60s when the Vietnam buildup kept the economy out of recession. Note that the sharp decline in 2010 was related to the housing tax credit policy in 2009 - and was just a continuation of the housing bust.

This graph shows the YoY change in New Home Sales from the Census Bureau.
Note: the New Home Sales data is smoothed using a three month centered average before calculating the YoY change. The Census Bureau data starts in 1963.
It is interesting to look at the '86/'87 and the mid '90s periods. New Home sales fell in both of these periods, although not quite 20%. As I noted in earlier posts, the mid '80s saw a surge in defense spending and MEW that more than offset the decline in New Home sales. In the mid '90s, nonresidential investment remained strong.
Although new home sales were down towards the end of 2018, the decline wasn't that large historically. As I noted last Fall, I wasn't even on recession watch. Now new home sales are up slightly year-over-year, and 2019 will probably have the most sales since 2007. No worries.
Philly Fed: State Coincident Indexes increased in 46 states in June
by Calculated Risk on 7/24/2019 12:56:00 PM
From the Philly Fed:
The Federal Reserve Bank of Philadelphia has released the coincident indexes for the 50 states for June 2019. Over the past three months, the indexes increased in 47 states, decreased in one state, and remained stable in two, for a three-month diffusion index of 92. In the past month, the indexes increased in 46 states, decreased in one state, and remained stable in three, for a one-month diffusion index of 90.Note: These are coincident indexes constructed from state employment data. An explanation from the Philly Fed:
emphasis added
The coincident indexes combine four state-level indicators to summarize current economic conditions in a single statistic. The four state-level variables in each coincident index are nonfarm payroll employment, average hours worked in manufacturing by production workers, the unemployment rate, and wage and salary disbursements deflated by the consumer price index (U.S. city average). The trend for each state’s index is set to the trend of its gross domestic product (GDP), so long-term growth in the state’s index matches long-term growth in its GDP.
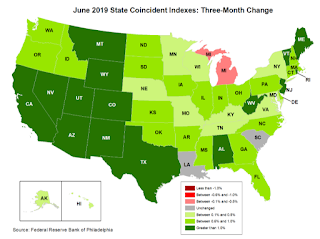 Click on map for larger image.
Here is a map of the three month change in the Philly Fed state coincident indicators. This map was all red during the worst of the recession, and all or mostly green during most of the recent expansion.
The map is mostly green on a three month basis, but there are some grey and red states.
Source: Philly Fed.
Note: For complaints about red / green issues, please contact the Philly Fed.
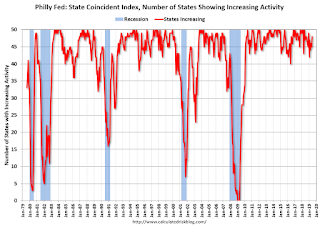 And here is a graph is of the number of states with one month increasing activity according to the Philly Fed. This graph includes states with minor increases (the Philly Fed lists as unchanged).
In June, 48 states had increasing activity (including minor increases).
A few Comments on June New Home Sales
by Calculated Risk on 7/24/2019 10:47:00 AM
New home sales for June were reported at 646,000 on a seasonally adjusted annual rate basis (SAAR). Sales for the previous three months were revised down.
This was the highest sales for June since June 2007, and annual sales in 2019 should be the best year for new home sales since 2007.
Earlier: New Home Sales increased to 646,000 Annual Rate in June.
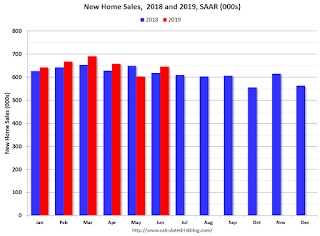
This graph shows new home sales for 2018 and 2019 by month (Seasonally Adjusted Annual Rate).
Sales in June were up 4.5% year-over-year compared to June 2018.
Year-to-date (through June), sales are up 2.2% compared to the same period in 2018.
This comparison was the most difficult in the first half of 2018, so this is a solid first half for 2019.
And here is another update to the "distressing gap" graph that I first started posting a number of years ago to show the emerging gap caused by distressed sales.
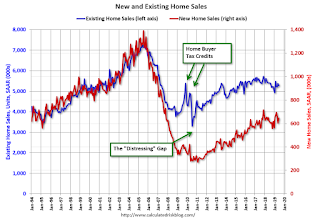
Following the housing bubble and bust, the "distressing gap" appeared mostly because of distressed sales.
Even though distressed sales are down significantly, following the bust, new home builders focused on more expensive homes - so the gap has only closed slowly.
I still expect this gap to close. However, this assumes that the builders will offer some smaller, less expensive homes.
Note: Existing home sales are counted when transactions are closed, and new home sales are counted when contracts are signed. So the timing of sales is different.
New Home Sales increased to 646,000 Annual Rate in June
by Calculated Risk on 7/24/2019 10:14:00 AM
The Census Bureau reports New Home Sales in June were at a seasonally adjusted annual rate (SAAR) of 646 thousand.
The previous three months were revised down.
"Sales of new single‐family houses in June 2019 were at a seasonally adjusted annual rate of 646,000, according to estimates released jointly today by the U.S. Census Bureau and the Department of Housing and Urban Development. This is 7.0 percent above the revised May rate of 604,000 and is 4.5 percent above the June 2018 estimate of 618,000."
emphasis added
 Click on graph for larger image.
The first graph shows New Home Sales vs. recessions since 1963. The dashed line is the current sales rate.
Even with the increase in sales over the last several years, new home sales are still somewhat low historically.
The second graph shows New Home Months of Supply.
 The months of supply decreased in June to 6.3 months from 6.7 months in May.
 The all time record was 12.1 months of supply in January 2009.
This is near the top of the normal range (less than 6 months supply is normal).
"The seasonally‐adjusted estimate of new houses for sale at the end of June was 338,000. This represents a supply of 6.3 months at the current sales rate."
 On inventory, according to the Census Bureau:
 "A house is considered for sale when a permit to build has been issued in permit-issuing places or work has begun on the footings or foundation in nonpermit areas and a sales contract has not been signed nor a deposit accepted."Starting in 1973 the Census Bureau broke this down into three categories: Not Started, Under Construction, and Completed.
The third graph shows the three categories of inventory starting in 1973.
The inventory of completed homes for sale is still somewhat low, and the combined total of completed and under construction is close to normal.
 The last graph shows sales NSA (monthly sales, not seasonally adjusted annual rate).
In June 2019 (red column), 57 thousand new homes were sold (NSA). Last year, 56 thousand homes were sold in June.
The all time high for June was 115 thousand in 2005, and the all time low for June was 28 thousand in 2010 and in 2011.
This was below expectations of 655 thousand sales SAAR, and sales in the three previous months were revised down. I'll have more later today.


