by Calculated Risk on 7/27/2019 08:11:00 AM
Saturday, July 27, 2019
Schedule for Week of July 28, 2019
The key report this week is the July employment report.
Other key reports include Personal Income and Outlays for June, Case-Shiller house prices for May, and the Trade deficit for June.
For manufacturing, the July Dallas Fed, and the July ISM manufacturing surveys will be released.
The FOMC meets this week, and the Fed is expected to announce a 25bps cut to the Fed Funds rate.
10:30 AM: Dallas Fed Survey of Manufacturing Activity for July. This is the last of the regional surveys for July.
8:30 AM ET: Personal Income and Outlays, June 2019. The consensus is for a 0.3% increase in personal income, and for a 0.3% increase in personal spending. And for the Core PCE price index to increase 0.2%.
 9:00 AM: S&P/Case-Shiller House Price Index for May.
This graph shows the year-over-year change in the seasonally adjusted National Index, Composite 10 and Composite 20 indexes through the most recent report (the Composite 20 was started in January 2000).
The consensus is for a 2.6% year-over-year increase in the Comp 20 index for May.
10:00 AM: Pending Home Sales Index for June. The consensus is for a 0.3% increase in the index.
7:00 AM ET: The Mortgage Bankers Association (MBA) will release the results for the mortgage purchase applications index.
8:15 AM: The ADP Employment Report for July. This report is for private payrolls only (no government). The consensus is for 155,000 payroll jobs added in July, up from 102,000 added in June.
9:45 AM: Chicago Purchasing Managers Index for July.
2:00 PM: FOMC Meeting Announcement. The Fed is expected to announce a 25bps cut to the Fed Funds rate at this meeting.
2:30 PM: Fed Chair Jerome Powell holds a press briefing following the FOMC announcement.
8:30 AM: The initial weekly unemployment claims report will be released. The consensus is for 213 thousand initial claims, up from 206 thousand last week.
 10:00 AM: ISM Manufacturing Index for July. The consensus is for the ISM to be at 51.9, up from 51.7 in June.
Here is a long term graph of the ISM manufacturing index.
The employment index was at 54.5 in June, and the new orders index was at 50.0%.
10:00 AM: Construction Spending for June. The consensus is for a 0.4% increase in construction spending.
 8:30 AM: Employment Report for July. The consensus is for 156,000 jobs added, and for the unemployment rate to decline to 3.6%.
There were 224,000 jobs added in June, and the unemployment rate was at 3.7%.
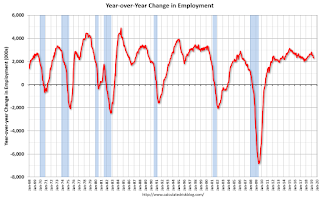
This graph shows the year-over-year change in total non-farm employment since 1968.
In June, the year-over-year change was 2.301 million jobs.
 8:30 AM: Trade Balance report for June from the Census Bureau.
 This graph shows the U.S. trade deficit, with and without petroleum, through the most recent report. The blue line is the total deficit, and the black line is the petroleum deficit, and the red line is the trade deficit ex-petroleum products.
The consensus is the trade deficit to be $54.7 billion. The U.S. trade deficit was at $55.5 Billion the previous month.
10:00 AM: University of Michigan's Consumer sentiment index (Final for July). The consensus is for a reading of 98.4.
Friday, July 26, 2019
Hotels: Occupancy Rate Decreased Year-over-year
by Calculated Risk on 7/26/2019 05:05:00 PM
From HotelNewsNow.com: STR: US hotel results for week ending 20 July
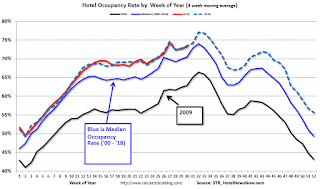
The U.S. hotel industry reported mixed year-over-year results in the three key performance metrics during the week of 14-20 July 2019, according to data from STR.The following graph shows the seasonal pattern for the hotel occupancy rate using the four week average.
In comparison with the week of 15-21 July 2018, the industry recorded the following:
• Occupancy: -0.5% to 77.9%
• Average daily rate (ADR): +0.5% to US$136.49
• Revenue per available room (RevPAR): flat at US$106.34
emphasis added
 Click on graph for larger image.
The red line is for 2019, dash light blue is 2018 (record year), blue is the median, and black is for 2009 (the worst year probably since the Great Depression for hotels).
Occupancy has been solid in 2019, close to-date compared to the previous 4 years.
Seasonally, the occupancy rate will now stay at a high level during the Summer travel season.
Data Source: STR, Courtesy of HotelNewsNow.com
Real GDP Annual and Quarterly
by Calculated Risk on 7/26/2019 11:44:00 AM
The following graphs show real GDP quarterly (blue, annualized), and the year-over-year change in GDP (red).
The tax changes at the end of 2017 have had minimal impact on GDP. Most forecasts showed some minor boost in 2018 and 2019 followed by a minor drag starting in 2020. With the new budget agreement, there probably will be little drag from fiscal policy next year.
Also, as shown earlier, there was no investment boom following the tax changes.
However, the tax changes did result in a large increase in the budget deficit (as predicted by all competent analysts).

This rate of growth is about what we should expect, see: Demographics and GDP: 2% is the new 4%
Q2 GDP: Investment
by Calculated Risk on 7/26/2019 08:58:00 AM
Investment was weak again in Q2, although personal consumption expenditures (PCE) was strong (increased at a 4.3% annual rate).
The first graph below shows the contribution to GDP from residential investment, equipment and software, and nonresidential structures (3 quarter trailing average). This is important to follow because residential investment tends to lead the economy, equipment and software is generally coincident, and nonresidential structure investment trails the economy.
In the graph, red is residential, green is equipment and software, and blue is investment in non-residential structures. So the usual pattern - both into and out of recessions is - red, green, blue.
The dashed gray line is the contribution from the change in private inventories.

Residential investment (RI) decreased in Q2 (-1.5% annual rate in Q2). Equipment investment increased slightly at a 0.7% annual rate, and investment in non-residential structures decreased at a 10.6% annual rate.
On a 3 quarter trailing average basis, RI (red) is down slightly, equipment (green) is slightly positive, and nonresidential structures (blue) is down slightly.
Recently RI has been soft, but the decrease is fairly small.
I'll post more on the components of non-residential investment once the supplemental data is released.

Residential Investment as a percent of GDP decreased in Q2, however RI has generally been increasing. RI as a percent of GDP is close to the bottom of the previous recessions - and I expect RI to continue to increase further in this cycle.
I'll break down Residential Investment into components after the GDP details are released.
Note: Residential investment (RI) includes new single family structures, multifamily structures, home improvement, broker's commissions, and a few minor categories.

BEA: Real GDP increased at 2.1% Annualized Rate in Q2
by Calculated Risk on 7/26/2019 08:35:00 AM
From the BEA: Gross Domestic Product, Second Quarter 2019 (Advance Estimate) and Annual Update
Real gross domestic product (GDP) increased at an annual rate of 2.1 percent in the second quarter of 2019, according to the "advance" estimate released by the Bureau of Economic Analysis. In the first quarter, real GDP increased 3.1 percent. ...The advance Q2 GDP report, with 2.1% annualized growth, was slightly above expectations.
The increase in real GDP in the second quarter reflected positive contributions from personal consumption expenditures (PCE), federal government spending, and state and local government spending that were partly offset by negative contributions from private inventory investment, exports, nonresidential fixed investment and residential fixed investment. Imports, which are a subtraction in the calculation of GDP, increased.
The deceleration in real GDP in the second quarter reflected downturns in inventory investment, exports, and nonresidential fixed investment. These downturns were partly offset by accelerations in PCE and federal government spending.
emphasis added
Personal consumption expenditures (PCE) increased at 4.3% annualized rate in Q2, up from 1.1% in Q1. Residential investment (RI) decreased 1.5% in Q2. Equipment investment increased at a 0.7% annualized rate, and investment in non-residential structures decreased at a 10.6% pace.
I'll have more later ...
Thursday, July 25, 2019
Friday: Q2 GDP
by Calculated Risk on 7/25/2019 07:26:00 PM
From Merrill Lynch today:
"On balance, this morning's data resulted in a net drag of 0.4pp on 2Q GDP tracking and brought our estimate down to 1.9% qoq saar from 2.3%."Friday:
• At 8:30 AM ET, Gross Domestic Product, 2nd quarter 2019 (advance estimate), and annual update. The consensus is that real GDP increased 1.9% annualized in Q2, down from 3.1% in Q1.
New Home Prices
by Calculated Risk on 7/25/2019 04:28:00 PM
As part of the new home sales report released yesterday, the Census Bureau reported the number of homes sold by price and the average and median prices.
From the Census Bureau: "The median sales price of new houses sold in June 2019 was $310,400. The average sales price was $368,600."
The following graph shows the median and average new home prices.

During the housing bust, the builders had to build smaller and less expensive homes to compete with all the distressed sales. When housing started to recovery - with limited finished lots in recovering areas - builders moved to higher price points to maximize profits.
Now it appears the home builders are offering some less expensive (and probably smaller) homes.
The average price in June 2019 2018 was $368,600, and the median price was $310,400.
The second graph shows the percent of new homes sold by price.

The $400K+ bracket increased significantly since the housing recovery started, but has started to decline. Still, a majority of new homes (about 53%) in the U.S., are in the $200K to $400K range.
Kansas City Fed: "Tenth District Manufacturing Largely Unchanged Again in July"
by Calculated Risk on 7/25/2019 11:00:00 AM
From the Kansas City Fed: Tenth District Manufacturing Largely Unchanged Again in July
The Federal Reserve Bank of Kansas City released the July Manufacturing Survey today. According to Chad Wilkerson, vice president and economist at the Federal Reserve Bank of Kansas City, the survey revealed that Tenth District manufacturing activity was largely unchanged in July, while expectations for future activity remained moderately positive.Another weak regional report.
“Regional factory growth remained basically flat this month, and a number of firms noted increased uncertainty because of trade concerns and weaker domestic demand,” said Wilkerson. “However, nearly 80 percent of manufacturing contacts reported confidence in their local economy.”
...
The month-over-month composite index was -1 in July, similar to the reading of 0 in June and slightly lower than an index of 4 in May. The composite index is an average of the production, new orders, employment, supplier delivery time, and raw materials inventory indexes. The small change in manufacturing activity was mostly driven by a decline at durable production plants, including computers, electronic products, appliances, and miscellaneous manufacturing. Most month-over-month indexes edged lower in July, and the new orders, employment, and finished goods inventory indexes turned negative. However, the volume of shipments was flat after last month’s slowdown, and supplier delivery time increased. Nearly all of the year-over-year factory indexes increased, and the composite index rose from 4 to 11. The future composite index remained moderately positive, inching down from 11 to 9, while expectations for production, new orders, and capital expenditures edged higher.
emphasis added
HVS: Q2 2019 Homeownership and Vacancy Rates
by Calculated Risk on 7/25/2019 10:05:00 AM
The Census Bureau released the Residential Vacancies and Homeownership report for Q2 2019.
This report is frequently mentioned by analysts and the media to track household formation, the homeownership rate, and the homeowner and rental vacancy rates. However, there are serious questions about the accuracy of this survey.
This survey might show the trend, but I wouldn't rely on the absolute numbers. he Census Bureau is investigating the differences between the HVS, ACS and decennial Census, and analysts probably shouldn't use the HVS to estimate the excess vacant supply or household formation, or rely on the homeownership rate, except as a guide to the trend.
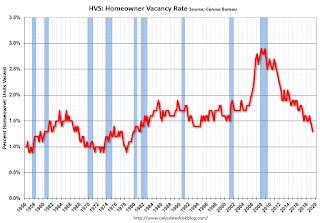
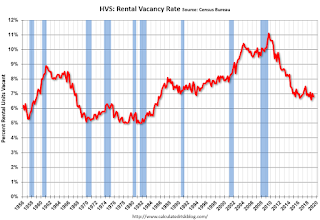
"National vacancy rates in the second quarter 2019 were 6.8 percent for rental housing and 1.3 percent for homeowner housing. The rental vacancy rate of 6.8 percent was virtually unchanged from the rate in the second quarter 2018 and not statistically different from the rate in the first quarter 2019 (7.0 percent). The homeowner vacancy rate of 1.3 percent was 0.2 percentage points lower than the rate in the second quarter 2018 (1.5 percent), but not statistically different from the rate in the first quarter 2019 (1.4 percent).
The homeownership rate of 64.1 percent was not statistically different from the rate in the second quarter 2018 (64.3 percent) nor from the rate in the first quarter 2019 (64.2 percent). "
 Click on graph for larger image.
The Red dots are the decennial Census homeownership rates for April 1st 1990, 2000 and 2010. The HVS homeownership rate decreased to 64.1% in Q2, from 64.2% in Q1.
I'd put more weight on the decennial Census numbers. However, given changing demographics, the homeownership rate has bottomed.
 The HVS homeowner vacancy decreased to 1.3% in Q2.
 Once again - this probably shows the general trend, but I wouldn't rely on the absolute numbers.
 The rental vacancy rate decreased to 6.8% in Q2.
The quarterly HVS is the most timely survey on households, but there are many questions about the accuracy of this survey.
Overall this suggests that vacancies have declined significantly, and my guess is the homeownership rate has bottomed - and that the rental vacancy rate is close to the bottom for this cycle.
Weekly Initial Unemployment Claims decreased to 206,000
by Calculated Risk on 7/25/2019 08:34:00 AM
The DOL reported:
In the week ending July 20, the advance figure for seasonally adjusted initial claims was 206,000, a decrease of 10,000 from the previous week's unrevised level of 216,000. The 4-week moving average was 213,000, a decrease of 5,750 from the previous week's unrevised average of 218,750.The previous week was unrevised.
emphasis added
The following graph shows the 4-week moving average of weekly claims since 1971.
 Click on graph for larger image.
The dashed line on the graph is the current 4-week average. The four-week average of weekly unemployment claims decreased to 213,000.
This was lower than the consensus forecast.


