by Calculated Risk on 8/09/2019 11:17:00 AM
Friday, August 09, 2019
Q3 GDP Forecasts: 1.6% to 1.9%
From Merrill Lynch:
We continue to track 1.8% for 2Q GDP and 1.7% for 3Q. [Aug 9 estimate]From the NY Fed Nowcasting Report
emphasis added
The New York Fed Staff Nowcast stands at 1.6% for 2019:Q3. [Aug 9 estimate].And from the Altanta Fed: GDPNow
The GDPNow model estimate for real GDP growth (seasonally adjusted annual rate) in the third quarter of 2019 is 1.9 percent on August 8, unchanged from August 2. [Aug 8 estimate]CR Note: These early estimates suggest real GDP growth will be in the high 1% range annualized in Q3.
Merrill: "We are worried, Recession risks are rising"
by Calculated Risk on 8/09/2019 09:14:00 AM
A few brief excerpts from a Merrill Lynch research note: Recession risks are rising
Our baseline is that this is simply the third mini-cycle in this expansion and that the economy will return to above-trend growth at the end of next year after a soft patch. ... However, we are worried that the economy will not be as lucky this time around for a few reasons: 1) later stages in the cycle - the economy has returned to full capacity and we no longer have "easy growth"; 2) monetary policy tools are limited; 3) there is a persistent external shock hitting the global economy - the trade war - creating high uncertainty across the global economy.CR Note: I'm not currently on recession watch, but I agree the risks have increased.
…
As we have consistently noted, expansions do not die of old age, but they can die from a policy mistake. And we are ripe for a policy mistake today.
…
We now have a number of early indicators starting to signal heightened risk of recession. Our official model has the probability of a recession over the next 12 months only pegged at about 20%, but our subjective call based on the slew of data and events leads us to believe it is closer to a 1-in-3 chance.
Thursday, August 08, 2019
"No, Mortgage Rates Are No Longer "Sharply Lower" This Week!"
by Calculated Risk on 8/08/2019 07:11:00 PM
From Matthew Graham at Mortgage News Daily: No, Mortgage Rates Are No Longer "Sharply Lower" This Week!
Mortgage rates were sharply higher today, with the average 30yr fixed rate quote rising by almost an eighth of a percentage point in some cases. A move of that magnitude in one day is the sort of thing that only happens a few times a year. [Most Prevalent Rates 30YR FIXED - 3.75%]Friday:
emphasis added
• At 8:30 AM ET, The Producer Price Index for July from the BLS. The consensus is for a 0.2% increase in PPI, and a 0.2% increase in core PPI.
Fannie and Freddie: Combined REO inventory declined in Q2, Down 18% Year-over-year
by Calculated Risk on 8/08/2019 03:01:00 PM
Fannie and Freddie earlier reported results for Q2 2019. Here is some information on Real Estate Owned (REOs).
Freddie Mac reported the number of REO declined to 5,869 at the end of Q2 2019 compared to 7,135 at the end of Q2 2018.
For Freddie, this is down 92% from the 74,897 peak number of REOs in Q3 2010.
Fannie Mae reported the number of REO declined to 17,913 at the end of Q2 2019 compared to 22,007 at the end of Q2 2018.
For Fannie, this is down 89% from the 166,787 peak number of REOs in Q3 2010.

Here is a graph of Fannie and Freddie Real Estate Owned (REO).
REO inventory decreased in Q2 2019, and combined inventory is down 18% year-over-year.
This is close to normal levels of REOs.
Hotels: Occupancy Rate Decreased Year-over-year
by Calculated Risk on 8/08/2019 12:58:00 PM
From HotelNewsNow.com: STR: U.S. hotel results for week ending 3 August
The U.S. hotel industry reported negative year-over-year results in the three key performance metrics during the week of 28 July through 3 August 2019, according to data from STR.The following graph shows the seasonal pattern for the hotel occupancy rate using the four week average.
In comparison with the week of 29 July through 4 August 2018, the industry recorded the following:
• Occupancy: -0.8% to 74.8%
• Average daily rate (ADR): -0.3% to US$133.03
• Revenue per available room (RevPAR): -1.1% at US$99.45
emphasis added
 Click on graph for larger image.
The red line is for 2019, dash light blue is 2018 (record year), blue is the median, and black is for 2009 (the worst year probably since the Great Depression for hotels).
Occupancy has been solid in 2019, close to-date compared to the previous 4 years.
Seasonally, the occupancy rate will now stay at a high level during the Summer travel season.
Data Source: STR, Courtesy of HotelNewsNow.com
Seattle Real Estate in July: Sales up 1.3% YoY, Inventory up 45% YoY from Low Levels
by Calculated Risk on 8/08/2019 10:39:00 AM
The Northwest Multiple Listing Service reported Northwest MLS brokers report mixed activity during July, as volume of closed sales reaches 12-month high
July provided mixed messages on housing activity, noted one industry veteran when commenting on the latest report from Northwest Multiple Listing Service. The newly released MLS figures show last month's closed sales reached a 12-month high. Member-brokers also reported the number of new listings (11,193) nearly matched pending sales (11,139).The press release is for the Northwest. In King County, sales were up slightly year-over-year, and active inventory was up 12% year-over-year.
A closer look at new listing activity shows last month's total was down from both the previous month (-6.7%) and the same month a year ago (-8.2%). The total number of active listings of single family homes and condos, at 16,787, was about the same as June's inventory (16,680) and the selection of a year ago (16,773 listings). A comparison of the 23 counties in the Northwest MLS report shows about half the counties have more inventory than a year ago, and half have less.
System-wide there is 1.76 months of inventory, with King, Kitsap, Mason, Pierce, Snohomish and Whatcom counties all reporting less than two months of supply.
emphasis added
In Seattle, sales were up 1.3% year-over-year, and inventory was up 45% year-over-year from very low levels. The year-over-year increase in inventory has slowed sharply (although still up 45%), and the months of supply is still low in Seattle (2.0 months). In many areas it appears the inventory build that started last year is ending.
Weekly Initial Unemployment Claims decreased to 209,000
by Calculated Risk on 8/08/2019 08:35:00 AM
The DOL reported:
In the week ending August 3, the advance figure for seasonally adjusted initial claims was 209,000, a decrease of 8,000 from the previous week's revised level. The previous week's level was revised up by 2,000 from 215,000 to 217,000. The 4-week moving average was 212,250, an increase of 250 from the previous week's revised average. The previous week's average was revised up by 500 from 211,500 to 212,000.The previous week was revised up.
emphasis added
The following graph shows the 4-week moving average of weekly claims since 1971.
 Click on graph for larger image.
The dashed line on the graph is the current 4-week average. The four-week average of weekly unemployment claims increased to 212,250.
This was lower than the consensus forecast.
Wednesday, August 07, 2019
Thursday: Unemployment Claims
by Calculated Risk on 8/07/2019 08:29:00 PM
Note: On October 23rd, I will be one of three speakers at the "2020 Economic Forecast featuring the UCI Paul Merage School of Business" in Newport Beach, California, sponsored by the Newport Beach Chamber of Commerce.
UCI Finance Professor Christopher Schwarz and I will be discussing the 2020 economic outlook, and Dr. Richard Afable will be discussing "The Future of the Healthcare System".
This is a lunch time event (from 11:15 am to 1:30 pm) at the Balboa Bay Resort.
Click here for more information and tickets. Tickets are $65 for members, and $75 for non-members and includes lunch. (I'm speaking for free).
Thursday:
• At 8:30 AM: The initial weekly unemployment claims report will be released. The consensus is for 215 thousand initial claims, unchanged from 215 thousand last week.
Real House Prices and Price-to-Rent Ratio in May
by Calculated Risk on 8/07/2019 03:48:00 PM
Here is the post last week on Case-Shiller: Case-Shiller: National House Price Index increased 3.4% year-over-year in May
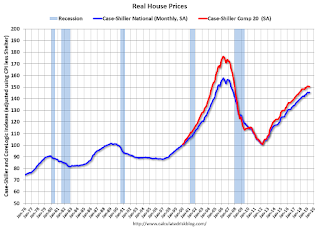
It has been over eleven years since the bubble peak. In the Case-Shiller release last week, the seasonally adjusted National Index (SA), was reported as being 13.2% above the previous bubble peak. However, in real terms, the National index (SA) is still about 7.8% below the bubble peak (and historically there has been an upward slope to real house prices). The composite 20, in real terms, is still 14.7% below the bubble peak.
The year-over-year increase in prices has slowed to 3.4% nationally, and I expect price growth will slow a little more, but not turn negative this year.
Usually people graph nominal house prices, but it is also important to look at prices in real terms (inflation adjusted). Case-Shiller and others report nominal house prices. As an example, if a house price was $200,000 in January 2000, the price would be close to $287,000 today adjusted for inflation (43%). That is why the second graph below is important - this shows "real" prices (adjusted for inflation).
Nominal House Prices

In nominal terms, the Case-Shiller National index (SA)and the Case-Shiller Composite 20 Index (SA) are both at new all times highs (above the bubble peak).
Real House Prices

In real terms, the National index is back to January 2005 levels, and the Composite 20 index is back to June 2004.
In real terms, house prices are at 2004/2005 levels.
Price-to-Rent
In October 2004, Fed economist John Krainer and researcher Chishen Wei wrote a Fed letter on price to rent ratios: House Prices and Fundamental Value. Kainer and Wei presented a price-to-rent ratio using the OFHEO house price index and the Owners' Equivalent Rent (OER) from the BLS.

This graph shows the price to rent ratio (January 2000 = 1.0). The price-to-rent ratio has been moving sideways to down recently.
On a price-to-rent basis, the Case-Shiller National index is back to February 2004 levels, and the Composite 20 index is back to October 2003 levels.
In real terms, prices are back to late 2004 levels, and the price-to-rent ratio is back to late 2003, early 2004.
Mortgage Rates and Ten Year Yield
by Calculated Risk on 8/07/2019 11:20:00 AM
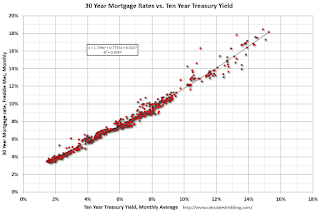
With the ten year yield at 1.63%, and based on an historical relationship, 30-year rates should currently be around 3.5%.
As of yesterday, Mortgage News Daily reported: Lowest Rates Since November 2016
Mortgage rates hit their lowest levels since November 2016 late last week and they've proceeded to set a new long-term low each day since then. [30YR FIXED - 3.5% - 3.75% (wider range than normal due to volatility)]The graph shows the relationship between the monthly 10 year Treasury Yield and 30 year mortgage rates from the Freddie Mac survey.
emphasis added
 Currently the 10 year Treasury yield is at 1.63%, and 30 year mortgage rates were at 3.75% according to the Freddie Mac survey last week - and rates will probably be lower in the survey for this week.
The record low in the Freddie Mac survey was 3.31% in November 2012 (Survey started in 1971).
To fall to 3.31% on the Freddie Mac survey, and based on the historical relationship, the Ten Year yield would have to fall to around 1.4% (but there is some variability in the relationship).


