by Calculated Risk on 8/28/2019 07:00:00 AM
Wednesday, August 28, 2019
MBA: Mortgage Applications Decreased in Latest Weekly Survey
From the MBA: Mortgage Applications Decrease in Latest MBA Weekly Survey
Mortgage applications decreased 6.2 percent from one week earlier, according to data from the Mortgage Bankers Association’s (MBA) Weekly Mortgage Applications Survey for the week ending August 23, 2019.
... The Refinance Index decreased 8 percent from the previous week and was 167 percent higher than the same week one year ago. The seasonally adjusted Purchase Index decreased 4 percent from one week earlier. The unadjusted Purchase Index decreased 6 percent compared with the previous week and was 2 percent higher than the same week one year ago.
...
“U.S. Treasury yields were volatile over the course of the week, as the ongoing trade dispute between the U.S. and China continued to generate uncertainty among investors. Rates increased for the first time since the week of July 12, but were still 80 basis points lower than the beginning of the year,” said Joel Kan, MBA’s Associate Vice President of Economic and Industry Forecasting. “With rates edging higher, refinances and purchase applications fell, at 8 percent and 6 percent, respectively.”
Added Kan, “Purchase applications were still up around 2 percent year-over-year last week, but the drop in rates this summer have not yet led to a significant boost in activity. Uncertainty over the near-term economic outlook and low supply continue to be the predominant headwinds for prospective homebuyers.”
...
The average contract interest rate for 30-year fixed-rate mortgages with conforming loan balances ($484,350 or less) increased to 3.94 percent from 3.90 percent, with points increasing to 0.38 from 0.35 (including the origination fee) for 80 percent loan-to-value ratio (LTV) loans.
emphasis added
 Click on graph for larger image.
The first graph shows the refinance index since 1990.
Mortgage rates have declined from close to 5% late last year to under 4%.
With lower rates, we saw a recent sharp increase in refinance activity.
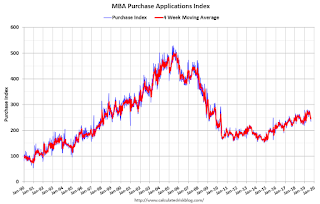
 The second graph shows the MBA mortgage purchase index
According to the MBA, purchase activity is up 2% year-over-year.
Tuesday, August 27, 2019
2020 Economic Forecast featuring the UCI Paul Merage School of Business
by Calculated Risk on 8/27/2019 09:40:00 PM
On October 23rd, I will be one of three speakers at the "2020 Economic Forecast featuring the UCI Paul Merage School of Business" in Newport Beach, California, sponsored by the Newport Beach Chamber of Commerce.
UCI Finance Professor Christopher Schwarz and I will be discussing the 2020 economic outlook, and Dr. Richard Afable will be discussing "The Future of the Healthcare System".
This is a lunch time event (from 11:15 am to 1:30 pm) at the Balboa Bay Resort.
Click here for more information and tickets. Tickets are $65 for members, and $75 for non-members and includes lunch. (I'm speaking for free).
Or click on the banner below.

"Chemical Activity Barometer Down in August"
by Calculated Risk on 8/27/2019 02:04:00 PM
Note: This appears to be a leading indicator for industrial production.
From the American Chemistry Council: Chemical Activity Barometer Down in August
The Chemical Activity Barometer (CAB), a leading economic indicator created by the American Chemistry Council (ACC), fell 0.1 percent in August on a three-month moving average (3MMA) basis following a similar drop in July and four months of gains. On a year-over-year (Y/Y) basis, the barometer was flat at 0.0 percent (3MMA).
The unadjusted measure of the CAB fell 0.5 percent in August after a 0.1 percent gain in July. The diffusion index was 59 percent in August. The diffusion index marks the number of positive contributors relative to the total number of indicators monitored. The CAB reading for July was revised upward by 0.58 points and that for June by 0.62 points.
“A pattern of fluctuating CAB readings – months up followed by months down – indicates late-cycle activity,” said Kevin Swift, chief economist at ACC. “The barometer signals gains in U.S. commerce into early 2020, but at a slow pace, while rising volatility suggests change may be coming.”
...
Applying the CAB back to 1912, it has been shown to provide a lead of two to fourteen months, with an average lead of eight months at cycle peaks as determined by the National Bureau of Economic Research. The median lead was also eight months. At business cycle troughs, the CAB leads by one to seven months, with an average lead of four months. The median lead was three months. The CAB is rebased to the average lead (in months) of an average 100 in the base year (the year 2012 was used) of a reference time series. The latter is the Federal Reserve’s Industrial Production Index.
emphasis added
 Click on graph for larger image.
This graph shows the year-over-year change in the 3-month moving average for the Chemical Activity Barometer compared to Industrial Production. It does appear that CAB (red) generally leads Industrial Production (blue).
The year-over-year change in the CAB suggests that the YoY increase in industrial production will probably slow further.
Update: A few comments on the Seasonal Pattern for House Prices
by Calculated Risk on 8/27/2019 12:34:00 PM
CR Note: This is a repeat of earlier posts with updated graphs.
A few key points:
1) There is a clear seasonal pattern for house prices.
2) The surge in distressed sales during the housing bust distorted the seasonal pattern.
3) Even though distressed sales are down significantly, the seasonal factor is based on several years of data - and the factor is now overstating the seasonal change (second graph below).
4) Still the seasonal index is probably a better indicator of actual price movements than the Not Seasonally Adjusted (NSA) index.
For in depth description of these issues, see former Trulia chief economist Jed Kolko's article "Let’s Improve, Not Ignore, Seasonal Adjustment of Housing Data"
Note: I was one of several people to question the change in the seasonal factor (here is a post in 2009) - and this led to S&P Case-Shiller questioning the seasonal factor too (from April 2010). I still use the seasonal factor (I think it is better than using the NSA data).

This graph shows the month-to-month change in the NSA Case-Shiller National index since 1987 (through June 2019). The seasonal pattern was smaller back in the '90s and early '00s, and increased once the bubble burst.
The seasonal swings have declined since the bubble.

The swings in the seasonal factors has started to decrease, and I expect that over the next several years - as recent history is included in the factors - the seasonal factors will move back towards more normal levels.
However, as Kolko noted, there will be a lag with the seasonal factor since it is based on several years of recent data.
Richmond Fed: "Manufacturing Activity Was Moderate in August"
by Calculated Risk on 8/27/2019 10:10:00 AM
From the Richmond Fed: Manufacturing Activity Was Moderate in August
Fifth District manufacturing activity was moderate in August, according to the most recent survey from the Federal Reserve Bank of Richmond. The composite index rose from −12 in July to 1 in August, buoyed by increases in the indexes for shipments and new orders. However, the third component, employment, fell.This was the last of the regional Fed surveys for August.
...
Survey results suggested that many firms saw employment decline while the average workweek increased in August. Respondents reported persistent wage growth but still struggled to find workers with the necessary skills.
emphasis added
Here is a graph comparing the regional Fed surveys and the ISM manufacturing index:
 Click on graph for larger image.
The New York and Philly Fed surveys are averaged together (yellow, through August), and five Fed surveys are averaged (blue, through August) including New York, Philly, Richmond, Dallas and Kansas City. The Institute for Supply Management (ISM) PMI (red) is through July (right axis).
The regional surveys were weak again in August, but slightly better than in July.
Based on these regional surveys, it seems likely the ISM manufacturing index for August will be weak again.
Case-Shiller: National House Price Index increased 3.1% year-over-year in June
by Calculated Risk on 8/27/2019 09:10:00 AM
S&P/Case-Shiller released the monthly Home Price Indices for June ("June" is a 3 month average of April, May and June prices).
This release includes prices for 20 individual cities, two composite indices (for 10 cities and 20 cities) and the monthly National index.
Note: Case-Shiller reports Not Seasonally Adjusted (NSA), I use the SA data for the graphs.
From S&P: Phoenix Replaces Las Vegas as Top City in Annual Gains According to the S&P CoreLogic Case-Shiller Index
The S&P CoreLogic Case-Shiller U.S. National Home Price NSA Index, covering all nine U.S. census divisions, reported a 3.1% annual gain in June, down from 3.3% in the previous month. The 10-City Composite annual increase came in at 1.8%, down from 2.2% in the previous month. The 20-City Composite posted a 2.1% year-over-year gain, down from 2.4% in the previous month.
Phoenix, Las Vegas and Tampa reported the highest year-over-year gains among the 20 cities. In June, Phoenix led the way with a 5.8% year-over-year price increase, followed by Las Vegas with a 5.5% increase, and Tampa with a 4.7% increase. Six of the 20 cities reported greater price increases in the year ending June 2019 versus the year ending May 2019.
...
Before seasonal adjustment, the National Index posted a month-over-month increase of 0.6% in June. The 10-City Composite posted a 0.2% increase and the 20-City Composite reported a 0.3% increase for the month. After seasonal adjustment, the National Index recorded a 0.2% month-over-month increase in June. The 10-City and the 20-City Composites did not report any gains. In June, 19 of 20 cities reported increases before seasonal adjustment, while 17 of 20 cities reported increases after seasonal adjustment.
“Home price gains continue to trend down, but may be leveling off to a sustainable level,” says Philip Murphy, Managing Director and Global Head of Index Governance at S&P Dow Jones Indices. “The average YOY gain declined to 3.0% in June, down from 3.1% the prior month. However, fewer cities (12) experienced lower YOY price gains than in May (13).
“The southwest (Phoenix and Las Vegas) remains the regional leader in home price gains, followed by the southeast (Tampa and Charlotte). With three of the bottom five cities (Seattle, San Francisco, and San Diego), much of the west coast is challenged to sustain YOY gains. For the second month in a row, however, only Seattle experienced outright decline with YOY price change of -1.3%. The U.S. National Home Price NSA Index YOY price change in June 2019 of 3.1% is exactly half of what it was in June 2018. While housing has clearly cooled off from 2018, home price gains in most cities remain positive in low single digits. Therefore, it is likely that current rates of change will generally be sustained barring an economic downturn.”
emphasis added
 Click on graph for larger image.
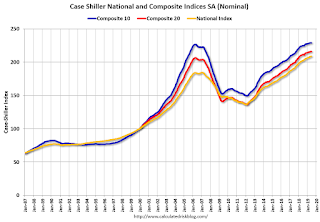
 The first graph shows the nominal seasonally adjusted Composite 10, Composite 20 and National indices (the Composite 20 was started in January 2000).
The Composite 10 index is up 1.0% from the bubble peak, and down slightly in June (SA) from May.
The Composite 20 index is 4.5% above the bubble peak, and up slightly (SA) in June.
The National index is 13.2% above the bubble peak (SA), and up 0.2% (SA) in June. The National index is up 53.1% from the post-bubble low set in December 2011 (SA).
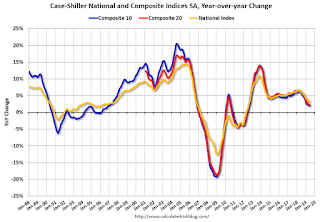
 The second graph shows the Year over year change in all three indices.
The Composite 10 SA is up 1.9% compared to June 2018. The Composite 20 SA is up 2.2% year-over-year.
The National index SA is up 3.1% year-over-year.
Note: According to the data, prices increased in 17 of 20 cities month-over-month seasonally adjusted.
I'll have more later.
Monday, August 26, 2019
Tuesday: Case-Shiller House Prices, Richmond Fed Mfg
by Calculated Risk on 8/26/2019 07:38:00 PM
From Matthew Graham at Mortgage News Daily: Mortgage Rates Mixed Versus Friday, Depending on Lender
Mortgage rates are sort of all over the place at the moment, and almost never where you'd expect. Those who haven't been following the bond market too closely generally expect higher rates than what we've been seeing recently. Those who are well-versed in the longstanding relationship between mortgages and Treasury yields generally expect rates to have fallen MUCH faster than they actually have.Tuesday:
…
All of the above having been said, the average lender is still very close to the lowest levels in 3 years. [Most Prevalent Rates 30YR FIXED - 3.5% - 3.625%]
emphasis added
• At 9:00 AM, S&P/Case-Shiller House Price Index for June. The consensus is for a 2.3% year-over-year increase in the Comp 20 index for June.
• Also at 9:00 AM, FHFA House Price Index for May 2019. This was originally a GSE only repeat sales, however there is also an expanded index.
• At 10:00 AM, Richmond Fed Survey of Manufacturing Activity for August. This is the last of the regional surveys for August.
Freddie Mac: Mortgage Serious Delinquency Rate declined in July
by Calculated Risk on 8/26/2019 04:35:00 PM
Freddie Mac reported that the Single-Family serious delinquency rate in July was 0.61%, down from 0.63% in June. Freddie's rate is down from 0.78% in July 2018.
Freddie's serious delinquency rate peaked in February 2010 at 4.20%.
This is the lowest serious delinquency rate for Freddie Mac since November 2007.
These are mortgage loans that are "three monthly payments or more past due or in foreclosure".

I expect the delinquency rate to decline to a cycle bottom in the 0.4% to 0.6% range - so this is close to a bottom.
Note: Fannie Mae will report for July soon.
Merrill and Goldman on Housing
by Calculated Risk on 8/26/2019 01:03:00 PM
A few excerpts from two research pieces on housing.
From Merrill Lynch: Housing: something for everyone What comes next?
[W]e are making some tweaks to the housing forecast. Housing starts are likely to edge down this year to 1.24mn but recover next year. Existing home sales should also come in lower this year at 5.30 million and hold around this pace in 2020. The story for new home sales is a bit better with 650k this year and 660k next. In other words, further sideways motion for housing activity, leaving it a benign factor for the overall economy.From Goldman Sachs: Can Lower Rates Still Boost Housing?
[O]ur estimate of the lag time between changes in interest rates and housing activity suggests the bulk of the boost is yet to come. ... we update our outlook for the growth boost from housing via both the homebuilding channel and the impact of refinancing, mortgage equity withdrawal, and housing wealth effects on consumer spending. Our model points to a healthy rebound to a 4% growth pace of residential investment in 2019H2 and an increase in the total contribution from housing to GDP growth from -0.05pp in H1 to +0.15pp in H2.CR Notes: This first graph shows the month to month comparison for total starts between 2018 (blue) and 2019 (red).
 Click on graph for larger image.
Year-to-date, starts are down 3.1% compared to the same period in 2018.
Last year, in 2018, starts were strong early in the year, and then fell off in the 2nd half - so the early comparisons this year were the most difficult.
My guess was starts would be down slightly year-over-year in 2019 compared to 2018, but nothing like the YoY declines we saw in February and March. Now it is possible starts will be unchanged or up slightly in 2019 compared to 2018.
 This graph shows new home sales for 2018 and 2019 by month (Seasonally Adjusted Annual Rate).
Year-to-date (through July), sales are up 4.1% compared to the same period in 2018.
The second half comparisons will be easier, so sales should be higher in 2019 than in 2018.
So my view is housing will be a positive for the economy in the 2nd half of 2019.
Dallas Fed: "Texas Manufacturing Expansion Picks Up Pace"
by Calculated Risk on 8/26/2019 10:35:00 AM
From the Dallas Fed: Texas Manufacturing Expansion Picks Up Pace
Texas factory activity expanded at a faster clip in August, according to business executives responding to the Texas Manufacturing Outlook Survey. The production index, a key measure of state manufacturing conditions, shot up nine points to 17.9, its highest reading in nearly a year.Some improvement, but another weak regional report.
Other measures of manufacturing activity also suggested faster expansion in August. The shipments index rose seven points to 17.6, and the capacity utilization index rose five points to 15.7, both reaching 11-month highs. The new orders index moved up from 5.5 to 9.3, while the growth rate of orders index was largely unchanged at 1.8.
Perceptions of broader business conditions improved in August. The general business activity index pushed into positive territory for the first time in four months, rising nine points to 2.7. Similarly, the company outlook index rose to 5.0 following three months in negative territory. However, the index measuring uncertainty regarding companies’ outlooks jumped nine points to 18.6, a reading well above average.
Labor market measures suggested slower growth in employment and work hours in August. The employment index remained positive but retreated 11 points to 5.5, a level closer to average. Eighteen percent of firms noted net hiring, while 12 percent noted net layoffs. The hours worked index edged down to 4.0.
emphasis added


