by Calculated Risk on 9/05/2019 08:32:00 AM
Thursday, September 05, 2019
Weekly Initial Unemployment Claims increased to 217,000
The DOL reported:
In the week ending August 31, the advance figure for seasonally adjusted initial claims was 217,000, an increase of 1,000 from the previous week's revised level. The previous week's level was revised up by 1,000 from 215,000 to 216,000. The 4-week moving average was 216,250, an increase of 1,500 from the previous week's revised average. The previous week's average was revised up by 250 from 214,500 to 214,750.The previous week was revised up.
emphasis added
The following graph shows the 4-week moving average of weekly claims since 1971.
 Click on graph for larger image.
The dashed line on the graph is the current 4-week average. The four-week average of weekly unemployment claims increased to 216,250.
This was close to the consensus forecast.
ADP: Private Employment increased 195,000 in August
by Calculated Risk on 9/05/2019 08:19:00 AM
Private sector employment increased by 195,000 jobs from July to August according to the August ADP National Employment Report®. ... The report, which is derived from ADP’s actual payroll data, measures the change in total nonfarm private employment each month on a seasonally-adjusted basis.This was above the consensus forecast for 150,000 private sector jobs added in the ADP report.
...
“In August we saw a rebound in private-sector employment,” said Ahu Yildirmaz, vice president and cohead of the ADP Research Institute. “This is the first time in the last 12 months that we have seen balanced job growth across small, medium and large-sized companies.”
Mark Zandi, chief economist of Moody’s Analytics, said, “Businesses are holding firm on their payrolls despite the slowing economy. Hiring has moderated, but layoffs remain low. As long as this continues recession will remain at bay.”
The BLS report will be released Friday, and the consensus is for 158,000 non-farm payroll jobs added in August.
Wednesday, September 04, 2019
Thursday: ADP Employment, Unemployment Claims, ISM Non-Mfg Index
by Calculated Risk on 9/04/2019 07:00:00 PM
Thursday:
• At 8:15 AM, The ADP Employment Report for August. This report is for private payrolls only (no government). The consensus is for 150,000 payroll jobs added in August, down from 156,000 added in July.
• At 8:30 AM, The initial weekly unemployment claims report will be released. The consensus is for 215 thousand initial claims, unchanged from 215 thousand the previous week.
• At 10:00 AM, the ISM non-Manufacturing Index for August. The consensus is for index to increase to 54.0 from 53.7 in July.
Fed's Beige Book: Economic Growth "Modest", Labor Market "Tight"
by Calculated Risk on 9/04/2019 02:03:00 PM
Fed's Beige Book "This report was prepared at the Federal Reserve Bank of Atlanta based on information collected on or before August 23, 2019."
On balance, reports from Federal Reserve Districts suggested that the economy expanded at a modest pace through the end of August. Although concerns regarding tariffs and trade policy uncertainty continued, the majority of businesses remained optimistic about the near-term outlook. Reports on consumer spending were mixed, although auto sales for most Districts grew at a modest pace. Tourism activity since the previous report remained solid in most reporting Districts. On balance, transportation activity softened, which some reporting Districts attributed to slowing global demand and heightened trade tensions. Home sales remained constrained in the majority of Districts due primarily to low inventory levels, and new home construction activity remained flat. Commercial real estate construction and sales activity were steady, while the pace of leasing increased slightly over the prior period. Overall manufacturing activity was down slightly from the previous report. Among reporting Districts, agricultural conditions remained weak as a result of unfavorable weather conditions, low commodity prices, and trade-related uncertainties. Lending volumes grew modestly across several Districts. Reports on activity in the nonfinancial services sector were positive, with reporting Districts noting similar or improved activity from the last report.
...
Overall, Districts indicated that employment grew at a modest pace, on par with the previous reporting period. While employment growth varied by industry, some Districts noted manufacturing employment was flat to down. Firms and staffing agencies universally cited tightness across various labor market segments and skill levels, which continued to constrain growth in overall business activity. On balance, Districts reported that the pace of wage growth remained modest to moderate, similar to the previous reporting period. Districts continued to report strong upward pressure on pay for entry-level and low-skill workers, as well as for technology, construction, and some professional services positions. In addition to wage increases, some Districts noted other efforts—such as enhanced benefits offerings, work arrangement flexibility, and signing bonuses—to attract and retain employees.
emphasis added
BLS: Employment Projections: 2018-2028
by Calculated Risk on 9/04/2019 11:41:00 AM
The BLS released today their updated Labor Force projections through 2028.
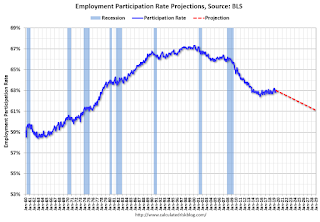
Their projections show the overall Labor Force Participation Rate (LFPR) declining to 61.2% in 2018 from the 63.0%.
Their projections also show that the Prime (25 to 54 year old) LFPR will decline slightly to 81.7% in 2028.
From the BLS: Employment Projections: 2018-2028 Summary
Employment is projected to grow by 8.4 million jobs to 169.4 million jobs over the 2018–28 decade, the U.S. Bureau of Labor Statistics (BLS) reported today. This expansion reflects an annual growth rate of 0.5 percent, which is slower than the 2008–18 annual growth rate of 0.8 percent. An aging population and labor force will contribute to changes expected over the coming decade including a continued decline in the labor force participation rate and continued growth in employment in healthcare and related industries and occupations.
…
The labor force is projected to increase at an annual rate of 0.5 percent from 2018 to 2028. This growth represents an increase of 8.9 million over the decade to 171 million by 2028. The labor force participation rate is projected to decline to 61.2 percent.
…
Much of the projected decline in the overall labor force participation rate from 2018 to 2028 is due to a decrease in the participation rate for men, from 69.1 percent to 66.1 percent. However, the participation rate for women is also expected to decline over the decade, from 57.1 percent to 56.6 percent.
emphasis added
 Click on graph for larger image.
This graph shows the actual overall Labor Force Participation Rate (blue), and the updated BLS projections (Red). Note: these projections were drawn as a line - it is possible that the overall LFPR could move sideways for some time prior to declining to the lower rate in 2028.
In general, these projections are similar to my own projections for both the overall LFPR and the Prime LFPR.
Trade Deficit decreased to $54.0 Billion in July
by Calculated Risk on 9/04/2019 08:43:00 AM
From the Department of Commerce reported:
The U.S. Census Bureau and the U.S. Bureau of Economic Analysis announced today that the goods and services deficit was $54.0 billion in July, down $1.5 billion from $55.5 billion in June, revised.
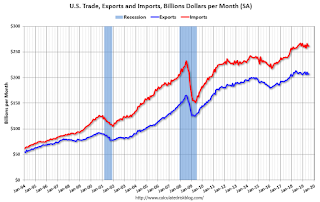
July exports were $207.4 billion, $1.2 billion more than June exports. July imports were $261.4 billion, $0.4 billion less than June imports.
 Click on graph for larger image.
Exports increased and imports decreased in July.
Exports are 25% above the pre-recession peak and down 1% compared to July 2018; imports are 13% above the pre-recession peak, and up slightly compared to July 2018.
In general, trade had been picking up, but both imports and exports have moved more sideways recently.
The second graph shows the U.S. trade deficit, with and without petroleum.
 The blue line is the total deficit, and the black line is the petroleum deficit, and the red line is the trade deficit ex-petroleum products.
Oil imports averaged $56.48 per barrel in July, down from $59.18 in June, and down from $64.54 in July 2018.
The trade deficit with China decreased to $32.8 billion in July, from $37.0 billion in July 2018.
MBA: Mortgage Applications Decreased in Latest Weekly Survey
by Calculated Risk on 9/04/2019 07:00:00 AM
From the MBA: Mortgage Applications Decrease in Latest MBA Weekly Survey
Mortgage applications decreased 3.1 percent from one week earlier, according to data from the Mortgage Bankers Association’s (MBA) Weekly Mortgage Applications Survey for the week ending August 30, 2019.
... The Refinance Index decreased 7 percent from the previous week and was 152 percent higher than the same week one year ago. The seasonally adjusted Purchase Index increased 4 percent from one week earlier. The unadjusted Purchase Index increased 1 percent compared with the previous week and was 5 percent higher than the same week one year ago.
...
“Ongoing trade tensions between the U.S. and China led to volatile, yet declining Treasury rates last week, causing the 30-year fixed mortgage rate to fall to 3.87 percent, its lowest level since November 2016,” said Joel Kan, MBA’s Associate Vice President of Economic and Industry Forecasting. “Despite lower borrowing costs, refinances were down from its recent peak two weeks ago, but still remained over 150 percent higher than last August, when rates were almost a percentage point higher.”
Added Kan, “Purchase applications increased 1 percent last week and were 5 percent higher than a year ago. Consumers continue to act on these lower rates, but the volatility in the market is likely leading some borrowers to pause refinancing and buying decisions.”
...
The average contract interest rate for 30-year fixed-rate mortgages with conforming loan balances ($484,350 or less) decreased to 3.87 percent from 3.94 percent, with points decreasing to 0.34 from 0.38 (including the origination fee) for 80 percent loan-to-value ratio (LTV) loans.
emphasis added
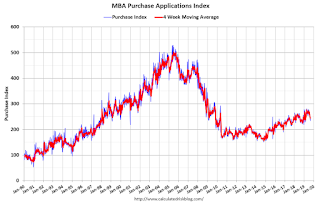
 Click on graph for larger image.
The first graph shows the refinance index since 1990.
Mortgage rates have declined from close to 5% late last year to under 4%.
With lower rates, we saw a recent sharp increase in refinance activity.
 The second graph shows the MBA mortgage purchase index
According to the MBA, purchase activity is up 5% year-over-year.
Tuesday, September 03, 2019
"Mortgage Rates Set Another Long-Term Low"
by Calculated Risk on 9/03/2019 07:25:00 PM
From Matthew Graham at Mortgage News Daily: Mortgage Rates Set Another Long-Term Low
Mortgage rates had to endure some paradoxical momentum and delayed reaction to the broader bond market rally lately, but now, it's payback time! Not only have mortgagees been able to move lower over the past 4 days, but they've done so even as Treasury yields remained flat. More simply put, 10yr Treasury yields ended the day just over 1.45% on last Wednesday. Today's comparable closing level of 1.46%. Mortgage rates, on the other hand, are down 0.08-0.11% over the same time frame, depending on the lender. While it's not a massive improvement versus Friday's latest levels, today's average offering is nonetheless the best in 3 years. [Most Prevalent Rates 30YR FIXED - 3.5% - 3.625%]Wednesday:
emphasis added
• At 7:00 AM ET: The Mortgage Bankers Association (MBA) will release the results for the mortgage purchase applications index.
• At 8:30 AM: Trade Balance report for July from the Census Bureau. The consensus is for the U.S. trade deficit to be at $55.2 billion in July unchanged from $55.2 billion in June.
• During the Day: The BLS is scheduled to release Labor Force projections through 2028.
• All day: Light vehicle sales for August. The consensus is for light vehicle sales to be 16.9 million SAAR in August, up from 16.8 million in July (Seasonally Adjusted Annual Rate).
• At 2:00 PM: the Federal Reserve Beige Book, an informal review by the Federal Reserve Banks of current economic conditions in their Districts.
Update: Framing Lumber Prices Down 20% Year-over-year
by Calculated Risk on 9/03/2019 02:29:00 PM
Here is another monthly update on framing lumber prices. Lumber prices declined from the record highs in early 2018, and are now down 15% to 25% year-over-year.
This graph shows two measures of lumber prices: 1) Framing Lumber from Random Lengths through Aug 16, 2019 (via NAHB), and 2) CME framing futures.

Right now Random Lengths prices are down 22% from a year ago, and CME futures are down 23% year-over-year.
There is a seasonal pattern for lumber prices, and usually prices will increase in the Spring, and peak around May, and then bottom around October or November - although there is quite a bit of seasonal variability.
The trade war is a factor with reports that lumber exports to China have declined by 40% since last September.
Construction Spending Increased Slightly in July, Down 2.7% YoY
by Calculated Risk on 9/03/2019 11:20:00 AM
From the Census Bureau reported that overall construction spending declined in July:
Construction spending during July 2019 was estimated at a seasonally adjusted annual rate of $1,288.8 billion, 0.1 percent above the revised June estimate of $1,288.1 billion. The July figure is 2.7 percent below the July 2018 estimate of $1,324.8 billion.Private spending decreased and public spending increased:
Spending on private construction was at a seasonally adjusted annual rate of $963.1 billion, 0.1 percent below the revised June estimate of $963.7 billion. ...
In July, the estimated seasonally adjusted annual rate of public construction spending was $325.7 billion, 0.4 percent above the revised June estimate of $324.3 billion.
emphasis added
 Click on graph for larger image.
This graph shows private residential and nonresidential construction spending, and public spending, since 1993. Note: nominal dollars, not inflation adjusted.
Private residential spending had been increasing - but turned down in the 2nd half of 2018 - and is now 25% below the bubble peak.
Non-residential spending is 10% above the previous peak in January 2008 (nominal dollars).
Public construction spending is at the previous peak in March 2009, and 24% above the austerity low in February 2014.
 The second graph shows the year-over-year change in construction spending.
On a year-over-year basis, private residential construction spending is down 7%. Non-residential spending is down 3% year-over-year. Public spending is up 4% year-over-year.
This was below consensus expectations. Another weak construction spending report.


