by Calculated Risk on 10/02/2019 11:05:00 AM
Wednesday, October 02, 2019
BEA: September Vehicles Sales increased to 17.2 Million SAAR
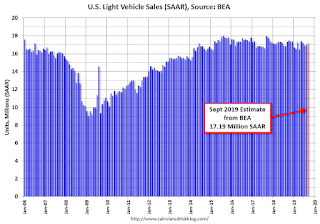
The BEA released their estimate of September vehicle sales this morning. The BEA estimated sales of 17.19 million SAAR in September 2019 (Seasonally Adjusted Annual Rate), up 1.1% from the August sales rate, and down 0.7% from September 2019.
Sales in 2019 are averaging 16.96 million (average of seasonally adjusted rate), down 1.1% compared to the same period in 2018.

This graph shows light vehicle sales since 2006 from the BEA (blue) and an estimate for September (red).
A small decline in sales to date this year isn't a concern - I think sales will move mostly sideways at near record levels.
This means the economic boost from increasing auto sales is over (from the bottom in 2009, auto sales boosted growth every year through 2016).

Note: dashed line is current estimated sales rate of 17.19 million SAAR.
ADP: Private Employment increased 135,000 in September
by Calculated Risk on 10/02/2019 08:19:00 AM
Private sector employment increased by 135,000 jobs from August to September according to the September ADP National Employment Report®. ... The report, which is derived from ADP’s actual payroll data, measures the change in total nonfarm private employment each month on a seasonally-adjusted basis.This was below the consensus forecast for 152,000 private sector jobs added in the ADP report.
...
“The job market has shown signs of a slowdown,” said Ahu Yildirmaz, vice president and co-head of the ADP Research Institute. “The average monthly job growth for the past three months is 145,000, down from 214,000 for the same time period last year.”
Mark Zandi, chief economist of Moody’s Analytics, said, “Businesses have turned more cautious in their hiring. Small businesses have become especially hesitant. If businesses pull back any further, unemployment will begin to rise.”
The BLS report will be released Friday, and the consensus is for 145,000 non-farm payroll jobs added in September.
MBA: Mortgage Applications Increased in Latest Weekly Survey
by Calculated Risk on 10/02/2019 07:00:00 AM
From the MBA: Mortgage Applications Increase in Latest MBA Weekly Survey
Mortgage applications increased 8.1 percent from one week earlier, according to data from the Mortgage Bankers Association’s (MBA) Weekly Mortgage Applications Survey for the week ending September 27, 2019.
... The Refinance Index increased 14 percent from the previous week and was 133 percent higher than the same week one year ago. The seasonally adjusted Purchase Index increased 1 percent from one week earlier. The unadjusted Purchase Index increased 1 percent compared with the previous week and was 10 percent higher than the same week one year ago.
...
“Mortgage rates mostly decreased last week, with the 30-year fixed rate dropping below 4 percent for the sixth time in the past nine weeks. Borrowers responded to these lower rates, leading to a 14 percent increase in refinance applications,” said Joel Kan, MBA’s Associate Vice President of Economic and Industry Forecasting. “Although refinance activity slowed in September compared to August, the months together were the strongest since October 2016. The slight changes in rates are still causing large swings in refinance volume, and we expect this sensitivity to persist.”
Added Kan, “Purchase applications also increased and remained more than 9 percent higher than a year ago. Low rates and healthy housing market fundamentals continue to support solid levels of purchase activity.”
...
The average contract interest rate for 30-year fixed-rate mortgages with conforming loan balances ($484,350 or less) decreased to 3.99 percent from 4.02 percent, with points remaining unchanged at 0.38 (including the origination fee) for 80 percent loan-to-value ratio (LTV) loans.
emphasis added
 Click on graph for larger image.
The first graph shows the refinance index since 1990.
With lower rates, we saw a sharp increase in refinance activity. Mortgage rates would have to decline further to see a huge refinance boom.
 The second graph shows the MBA mortgage purchase index
According to the MBA, purchase activity is up 10% year-over-year.
Tuesday, October 01, 2019
Wednesday: ADP Employment, Vehicle Sales
by Calculated Risk on 10/01/2019 06:32:00 PM
Wednesday:
• At 7:00 AM ET: The Mortgage Bankers Association (MBA) will release the results for the mortgage purchase applications index.
• At 8:15 AM: The ADP Employment Report for September. This report is for private payrolls only (no government). The consensus is for 152,000 jobs added, down from 195,000 in August.
• All day: Light vehicle sales for September. The consensus is for sales of 17.0 million SAAR, unchanged from 17.0 million SAAR in August (Seasonally Adjusted Annual Rate).
Reis: Office Vacancy Rate unchanged in Q3 at 16.8%
by Calculated Risk on 10/01/2019 01:48:00 PM
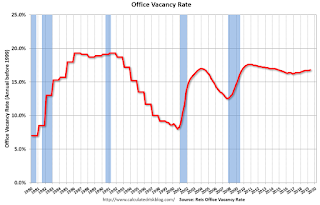
Reis reported that the office vacancy rate was at 16.8% in Q3, unchanged from 16.8% in Q2 2019. This is up from 16.7% in Q3 2018, and down from the cycle peak of 17.6%.
From Reis Senior Economist Barbara Byrne Denham:
The Office vacancy rate was flat in the quarter at 16.8%. In the third quarter of 2018 it was 16.7%. Overall vacancy has declined only 0.3% in last five years.
Both the national average asking rent and effective rent, which nets out landlord concessions, increased 0.6% in the third quarter. At $34.06 per square foot (asking) and $27.65 per square foot (effective), the average rents have increased 2.6% from the third quarter of 2018.
...
Office occupancy growth has been sluggish throughout this expansion as firms lease far fewer square feet per added job. Rent growth has also disappointed owners. Each quarter seems to bring more cautiousness as firms weather continued uncertainty from the trade war and global economy. Still, the U.S. has added 350,000 office jobs this year through August, down from 470,000 office jobs added in the first eight months of 2018, but further evidence of steady growth. This should keep office occupancy growth positive. Indeed, the news on the office market has not generated headlines, but growth remains positive and should remain positive this year and next.
 Click on graph for larger image.
This graph shows the office vacancy rate starting in 1980 (prior to 1999 the data is annual).
Reis reported the vacancy rate was at 16.8% in Q3. The office vacancy rate had been mostly moving sideways at an elevated level, but has increased over the last two years.
Office vacancy data courtesy of Reis.
Construction Spending Increased Slightly in August, Down 1.9% YoY
by Calculated Risk on 10/01/2019 11:18:00 AM
From the Census Bureau reported that overall construction spending increased slightly in August:
Construction spending during August 2019 was estimated at a seasonally adjusted annual rate of $1,287.3 billion, 0.1 percent above the revised July estimate of $1,285.6 billion. The August figure is 1.9 percent below the August 2018 estimate of $1,312.2 billion.Private spending decreased and public spending increased:
emphasis added
Spending on private construction was at a seasonally adjusted annual rate of $955.0 billion, nearly the same as the revised July estimate of $954.8 billion. ...
In August, the estimated seasonally adjusted annual rate of public construction spending was $332.3 billion, 0.4 percent above the revised July estimate of $330.8 billion.
emphasis added
 Click on graph for larger image.
This graph shows private residential and nonresidential construction spending, and public spending, since 1993. Note: nominal dollars, not inflation adjusted.
Private residential spending had been increasing - but turned down in the 2nd half of 2018 - and is now 25% below the bubble peak.
Non-residential spending is 8% above the previous peak in January 2008 (nominal dollars).
Public construction spending is 2% above the previous peak in March 2009, and 27% above the austerity low in February 2014.
 The second graph shows the year-over-year change in construction spending.
On a year-over-year basis, private residential construction spending is down 5%. Non-residential spending is down 3% year-over-year. Public spending is up 5% year-over-year.
This was slightly below consensus expectations. Another somewhat weak construction spending report.
ISM Manufacturing index Decreased to 47.8 in September
by Calculated Risk on 10/01/2019 10:05:00 AM
The ISM manufacturing index indicated contraction in September. The PMI was at 47.8% in September, down from 49.1% in August. The employment index was at 46.3%, down from 47.4% last month, and the new orders index was at 47.3%, up from 47.2%.
From the Institute for Supply Management: September 2019 Manufacturing ISM® Report On Business®
Economic activity in the manufacturing sector contracted in September, and the overall economy grew for the 125th consecutive month, say the nation’s supply executives in the latest Manufacturing ISM® Report On Business®.
The report was issued today by Timothy R. Fiore, CPSM, C.P.M., Chair of the Institute for Supply Management® (ISM®) Manufacturing Business Survey Committee: “The September PMI® registered 47.8 percent, a decrease of 1.3 percentage points from the August reading of 49.1 percent. The New Orders Index registered 47.3 percent, an increase of 0.1 percentage point from the August reading of 47.2 percent. The Production Index registered 47.3 percent, a 2.2-percentage point decrease compared to the August reading of 49.5 percent. The Employment Index registered 46.3 percent, a decrease of 1.1 percentage points from the August reading of 47.4 percent. The Supplier Deliveries Index registered 51.1 percent, a 0.3-percentage point decrease from the August reading of 51.4 percent. The Inventories Index registered 46.9 percent, a decrease of 3 percentage points from the August reading of 49.9 percent. The Prices Index registered 49.7 percent, a 3.7-percentage point increase from the August reading of 46 percent. The New Export Orders Index registered 41 percent, a 2.3-percentage point decrease from the August reading of 43.3 percent. The Imports Index registered 48.1 percent, a 2.1-percentage point increase from the August reading of 46 percent.
“Comments from the panel reflect a continuing decrease in business confidence. September was the second consecutive month of PMI® contraction, at a faster rate compared to August. Demand contracted, with the New Orders Index contracting at August levels, the Customers’ Inventories Index moving toward ‘about right’ territory and the Backlog of Orders Index contracting for the fifth straight month (and at a faster rate). The New Export Orders Index continued to contract strongly, a negative impact on the New Orders Index. Consumption (measured by the Production and Employment indexes) contracted at faster rates, again primarily driven by a lack of demand, contributing negative numbers (a combined 3.3-percentage point decrease) to the PMI® calculation. Inputs — expressed as supplier deliveries, inventories and imports — were again lower in September, due to inventory tightening for the fourth straight month. This resulted in a combined 3.3-percentage point decline in the Supplier Deliveries and Inventories indexes. Imports contraction slowed. Overall, inputs indicate (1) supply chains are meeting demand and (2) companies are continuing to closely match inventories to new orders. Prices decreased for the fourth consecutive month, but at a slower rate.
“Global trade remains the most significant issue, as demonstrated by the contraction in new export orders that began in July 2019. Overall, sentiment this month remains cautious regarding near-term growth,” says Fiore.
emphasis added
 Click on graph for larger image.
Here is a long term graph of the ISM manufacturing index.
This was well below expectations of 50.0%, and suggests manufacturing contracted further in September.
CoreLogic: House Prices up 3.6% Year-over-year in August
by Calculated Risk on 10/01/2019 08:37:00 AM
Notes: This CoreLogic House Price Index report is for August. The recent Case-Shiller index release was for July. The CoreLogic HPI is a three month weighted average and is not seasonally adjusted (NSA).
From CoreLogic: CoreLogic Reports August Home Prices Increased by 3.6% Year Over Year
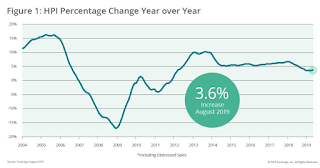
CoreLogic® ... today released the CoreLogic Home Price Index (HPI™) and HPI Forecast™ for August 2019, which shows home prices rose both year over year and month over month. Home prices increased nationally by 3.6% from August 2018. On a month-over-month basis, prices increased by 0.4% in August 2019. (July 2019 data was revised. Revisions with public records data are standard, and to ensure accuracy, CoreLogic incorporates the newly released public data to provide updated results each month.)
Home prices continue to increase on an annual basis with the CoreLogic HPI Forecast indicating annual price growth will increase 5.8% by August 2020. On a month-over-month basis, the forecast calls for home prices to increase by 0.3% from August 2019 to September 2019. The CoreLogic HPI Forecast is a projection of home prices calculated using the CoreLogic HPI and other economic variables. Values are derived from state-level forecasts by weighting indices according to the number of owner-occupied households for each state.
“The 3.6% increase in annual home price growth this August marked a big slowdown from a year earlier when the U.S. index was up 5.5%,” said Dr. Frank Nothaft, chief economist at CoreLogic. “While the slowdown in appreciation occurred across the country at all price points, it was most pronounced at the lower end of the market. Prices for the lowest-priced homes increased by 5.5%, compared with August 2018, when prices increased by 8.4%. This moderation in home-price growth should be welcome news to entry-level buyers.”
emphasis added
 This graph is from CoreLogic and shows the YoY change in their index.
CR Note: The YoY change in the CoreLogic index decreased over the last year, but is now moving sideways.
Monday, September 30, 2019
Tuesday: ISM Mfg, Construction Spending
by Calculated Risk on 9/30/2019 09:25:00 PM
From Matthew Graham at Mortgage News Daily: Mortgage Rates Lowest in Weeks
Over the past few business days, the sideways momentum gradually began to give way to modest improvements. Lenders have been slow to adjust their rate sheet offerings, but as of today, the average lender is back in line with its lowest rates since September 9th. More than a few lenders offered mid-day improvements today. [Most Prevalent Rates 30YR FIXED - 3.75%]Tuesday:
emphasis added
• At 10:00 AM, ISM Manufacturing Index for September. The consensus is for a reading of 50.0, up from 49.1 in August. The employment index was at 47.4%, and the new orders index was at 47.2%.
• Also at 10:00 AM, Construction Spending for August. The consensus is for a 0.3% increase.
• Early, Reis Q3 2019 Office Survey of rents and vacancy rates.
Fannie Mae: Mortgage Serious Delinquency Rate Unchanged in August
by Calculated Risk on 9/30/2019 04:26:00 PM
Fannie Mae reported that the Single-Family Serious Delinquency was unchanged at 0.67% in August, from 0.67% in July. The serious delinquency rate is down from 0.82% in August 2018.
These are mortgage loans that are "three monthly payments or more past due or in foreclosure".
The Fannie Mae serious delinquency rate peaked in February 2010 at 5.59%.
This matches last month as the lowest serious delinquency rate for Fannie Mae since June 2007.

By vintage, for loans made in 2004 or earlier (2% of portfolio), 2.50% are seriously delinquent. For loans made in 2005 through 2008 (4% of portfolio), 4.20% are seriously delinquent, For recent loans, originated in 2009 through 2018 (94% of portfolio), only 0.32% are seriously delinquent. So Fannie is still working through a few poor performing loans from the bubble years.
The increase in the delinquency rate in late 2017 was due to the hurricanes - there were no worries about the overall market.
I expect the serious delinquency rate will probably decline to 0.4 to 0.6 percent or so to a cycle bottom.
Note: Freddie Mac reported earlier.


